
Search
The Renewable Energy site for Do-It-Yourselfers
Performance of Kevin's $1K
Solar Water Heating System
This page gives the details on the
performance of Kevin's $1K solar water heating system.
Plots and comments on performance are provided for each month for nearly a full
year. Kevin lives in a very difficult climate and gets some shading in mid
winter, but the system still (I think) does quite well.
Thanks very much to Kevin for
providing this long track record of performance!!
Monthly Performance Plots
May 2009...
June 2009...
July 2009...
August 2009
...
September
2009...
October
2009...
November
2009... (see the note here on Nov, Dec, Jan, Feb performance)
December
2009...
January
2010...
February
2010...
March 2010...
May and June
2009
Performance for May 21 through June
19 of 2009.
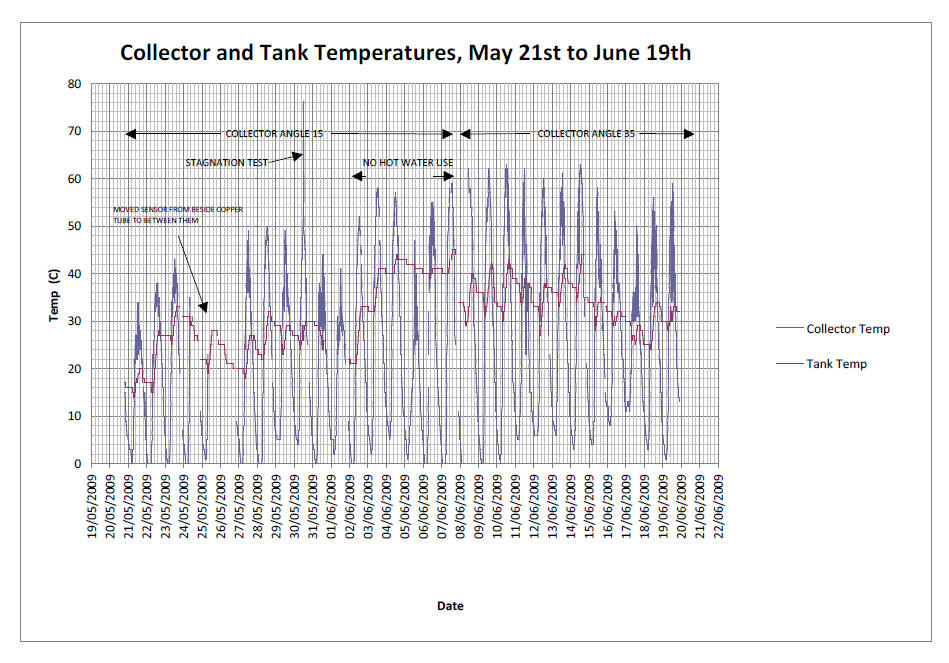
The system is achieving a somewhat
lower solar fraction than my system -- we think that this is due to the
following:
The collector area per gallon of
hot water demand is lower than my system. Kevin's family hot water use
is about 57 gallons per day and his collector area is 45 sqft of collector
area. This compares to our roughly 24 gallons per day and an effective
40 sqft of collector.
The ground water temperature in
Kevin's area is very low -- about 43F, so there is more heating to do.
In order to get better summer
performance, Kevin has changed the tilt to a more horizontal angle. The
performance graph shows the before and after, and the tilt change definitely
improves performance.
Some additional observations from
Kevin on performance:
* tank temp gain on sunny
days is 8 to 13 C
* Cloudy days don't gain much if anything, especially with hot
water demand at the same time (May 31 is a good example).
* Tank temp during periods of no hot water use is stable,
indicating minimal heat losses from the tank. See night of May
22/23, where the only drop was in the morning after a shower. I
added my insulation scraps to the sides and top of the tank
today for even more insulation, so there is a minimum of 3" of foam.
* Our family uses a lot of hot water! Tank temp drops fast with
hot water use. I was disappointed with this at first, but this
is exactly what I want - ready exchange of heat from the tank
into the water flowing through. Incoming water is at 6C, so the
exchanger is transferring a lot of heat during those 12 minute
showers that I timed.
* The stagnation test yesterday at 12:30 PM on a sunny day had a
peak temp of 76C (I saw 81C on the Steca between the 5 minute
datalogging readings).
Overall, I am happy with my
system. I realized beforehand that my hot water demand would be higher than
yours, but hoped the system would do better. But still, I am getting a solar
fraction of:
Incoming water temp 6C
Hot water tank set at 40C
Temp rise needed: 34C
Ave tank temp these days 35C
Solar temp rise = 35 - 6 = 29C
Solar fraction = 29/34 = 85%
July 2009
Performance Update:
Kevin sent in the performance update
for the month of July

From Kevin:
As promised, here is July data. The
family was away for a few weeks early in the month, so I thought this
would get a good test of the performance with low demand.
Unfortunately, it coincided with a period of cool, cloudy weather, so my
hopes of breaking the 50 C barrier weren't realized. Top tank temp was
48C. The last 2 weeks of the month were mostly hot and sunny. The tank
temps average about 40C, so this is hot enough that my hot water heater
hasn't come on at all since ~July 14th.
This looks better to me, so it looks
like the increased tilt helped some.
August 2009
Performance Update:
Kevin sent in the performance update
for the month of August.
Here is Kevin's note on the August
performance:
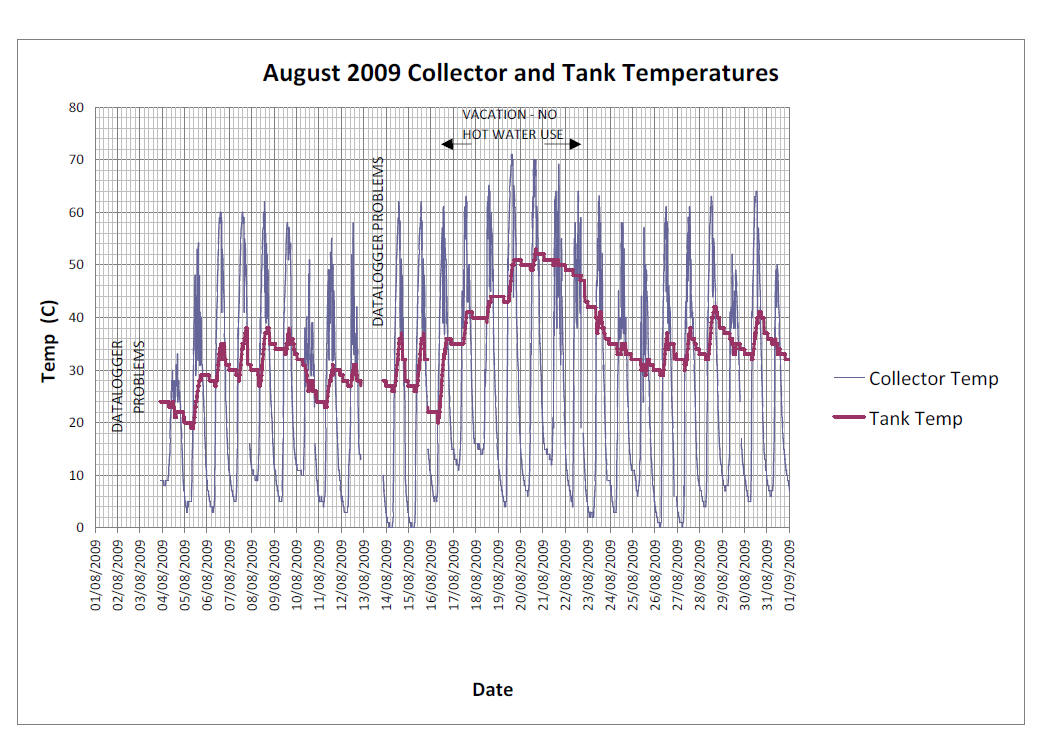
The notable part of this month was a 7
day period when we were on vacation. This is a good illustration of
what may be the maximum I can expect from the current system. The tank
temp got to 53C while we were gone, in a period of sunny weather. The
tank temps declined in the last few cloudy days of our absence, showing
heat loss from the tank. While we were home, the tank temps were mostly
between 30 and 40C, but dipped as low as 20C.
This month's performance led me to
start work on an additional collector panel, which will increase the
collector area by ~50%. That, and some tree removal now that the sun is
lower and the collectors are getting partial shade, should improve
things.
The data gaps were caused by low battery
voltage, running the datalogger using AA cells. I have since switched
to a wallwart power supply.
I decided to replace our showerhead.
The old one wasn't bad, at 2 USGPM, but we bought a new Waterpik
multi-setting one, and I especially like the pause feature. Flows from
the new one are 1.4 GPM in normal mode, 1.6 GPM in massage mode, and 0.6
GPM in pause mode. Everyone is happy with the new one. Now it's a
matter of training the household to use the pause setting when we can.
September
2009 Performance Update:
Performance plot for September 2009.
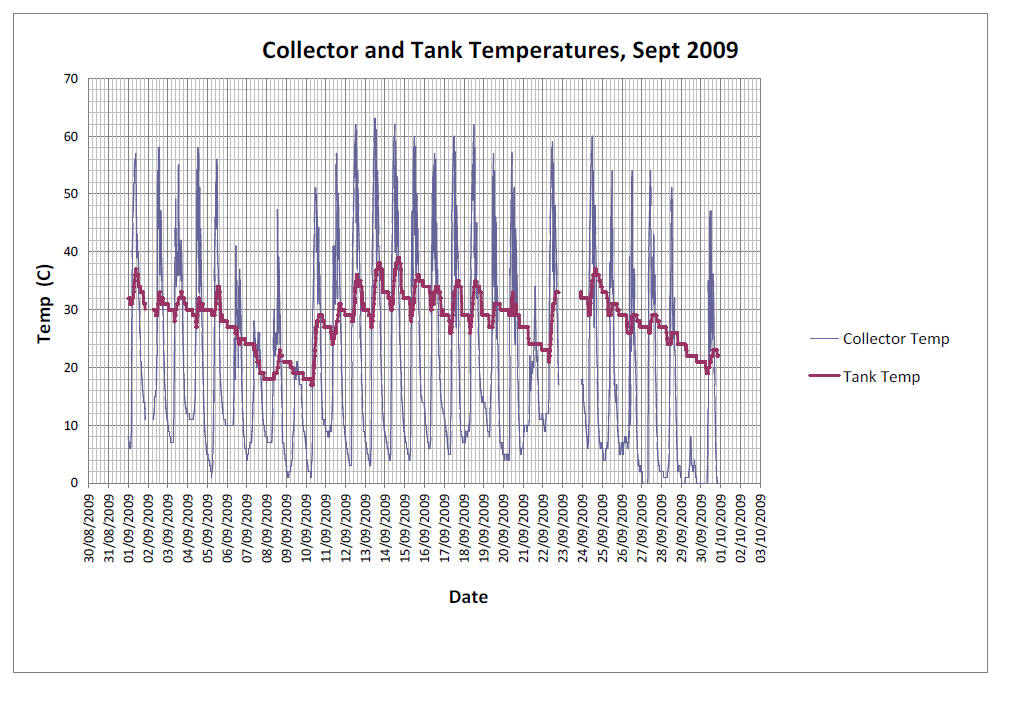
Some comments on September:
-
This month shows the
usual pattern of good performance in sunny stretches, and fairly steep
declines in tank temp in cloudy periods, due to high hot water demand.
There is good recovery when the first sunny day is reached after a period of
low tank temps, though.
-
One day to note is Sept.
29, with heavy overcast all day and snow sticking to the collector. I have
since steepened the collector angle from 35 degrees to 20 and applied
Rain-X.
Kevin
October 2009
Performance Update:
Performance plot for October of 2009.
Includes effect of an added 3 by 8 ft collector on the 11th.
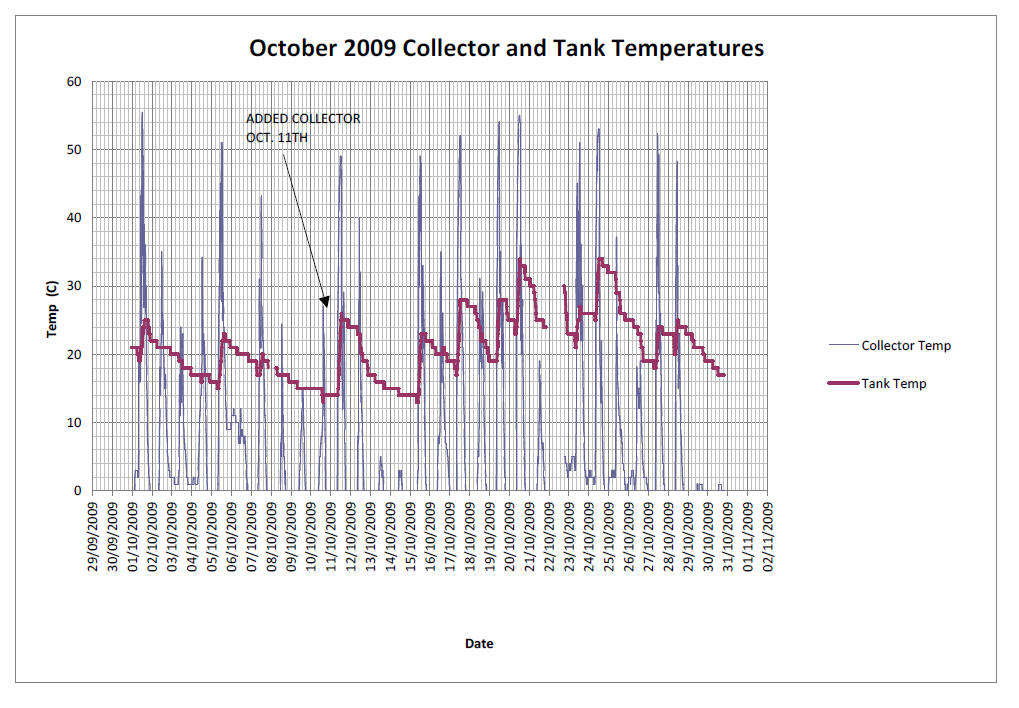
I commissioned my additional
panel on October 11th. It's a 3' X 8' one that is very similar to my existing
ones. The main changes are:
-
I made the frame lighter
(1X4 instead of 2X4 wood). This gave me an extra inch all around the
inside. I put in a strip of 1" polyiso around the inside of the frame to
hopefully provide more heat retention inside the panel. I put in a
temperature sensor so I could log temp data in this panel and compare to the
others.
-
I used another pump
(MCP355) dedicated to this panel, controlled by the same controller as the
old ones. The head is higher than the other ones (~11 feet vs. 8 feet).
-
I used 1/2" PEX for the
feed line and 3/4" PEX for the drain line - I had enough leftovers to use
1/2" for both, but I thought I might get better drainback with the 3/4".
-
The slope of the copper
pipe in the collector is 3%, and I mounted the collector with another 2%
slope, for vigorous drainback since it is 8' long.
-
I had a few hard plastic
Suntuf wiggle strips left over, but I bought the foam ones and used them for
most of the attachment of the Suntuf. The foam ones give a much tighter
seal and I would recommend them.
-
I mounted the new panel,
and switched the old ones, to 20 degrees tilt, and all three are adjustable.
Luckily I had a blue sky day
for the first day of operation, although it was unseasonably cold in early
October. This was the first day the system has started, run, and stopped in
below freezing conditions, and I am happy to report that there were no
problems. Starting temp was -7C, getting up to -1C. I gained 11C in the tank
in the 4 hours of operation until the trees in my yard shaded the collectors,
which bodes well for performance. A rise of 11C would be good performance for
running all day with the original collectors. I continue to be amazed at the
power of the sun, even in the cool half of the year - when it was -5C out, the
collector temp was +45C, giving a 50C difference!
October was not a very sunny
month at all. A pre- and post-expansion comparison can be seen for October 5th
performance (8 C tank temp rise) and after Oct. 11th (10 to 12C rise). There
were also some stormy days that were completely flat, with no collector temp
rise over the outside temp.
I am seeing that the new panel runs 2 to 4C higher in temp than the old ones,
and I am thinking that this is because of the insulation I put on the sides, as
well as maybe the tighter construction with the foam wiggle strips. If the new
panel runs hotter before the pump turns on, this is a good thing, indicating
better heat retention, but if it runs hotter when the pump is running, it may
mean that the panel is less efficient at transferring heat to the tank. So I
decided to do a stagnation test to check this out.
The new collector was running 3C hotter when I turned the pump off for the test,
and the new one climbed to 7C hotter and stayed there. The outside air temp was
+4C during the test, and the collector temps went from 44C to over 80C, which
covers the temperature range that they run at when the pumps are running. The
test results give me confidence that the extra insulation is effective and
should result in more heat available for the circulating water to collect.
Kevin
November 2009
Performance Update:
Here are monthly performance graphs for my
system for November through February. The short story is that from mid November
to the end of January, the system didn’t provide much useable heat, but by
February I was back in the game. It ran during those months when there was sun,
and I’m relieved to report that there were no freeze-up problems whatsoever.
Incoming water temps ranged from 8C at the start of November to 6C now. With the
low sun angles in winter, there is a lot more shading from trees in my yard,
which compounds the performance reduction from the fewer hours of sun.
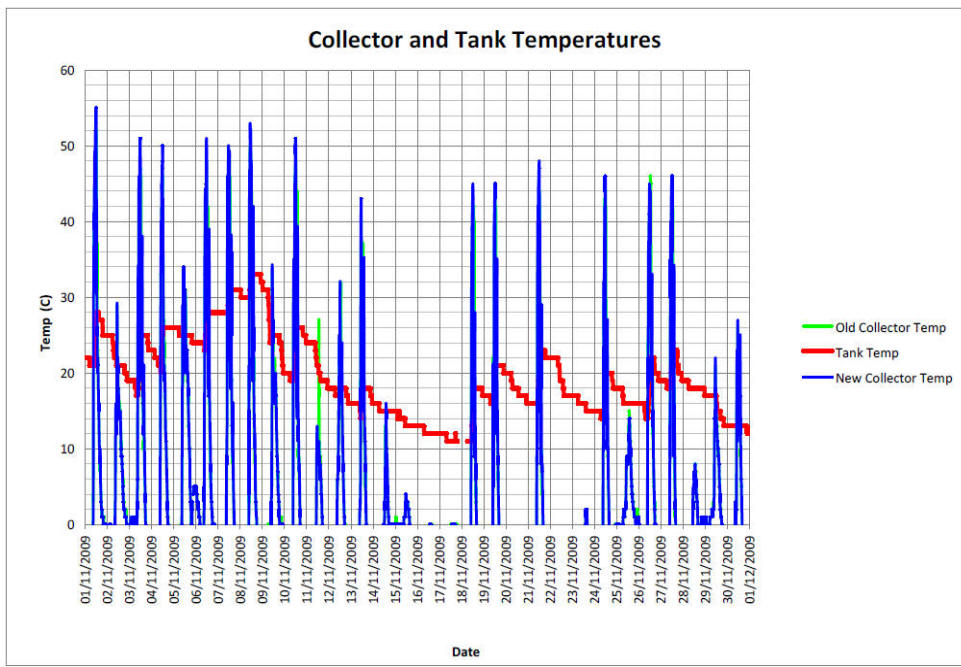
November shows a good first half of the month, with sunny days giving a maximum
collector temp of around 50C, then a period of cloudy weather that dropped the
tank temperature quite low.
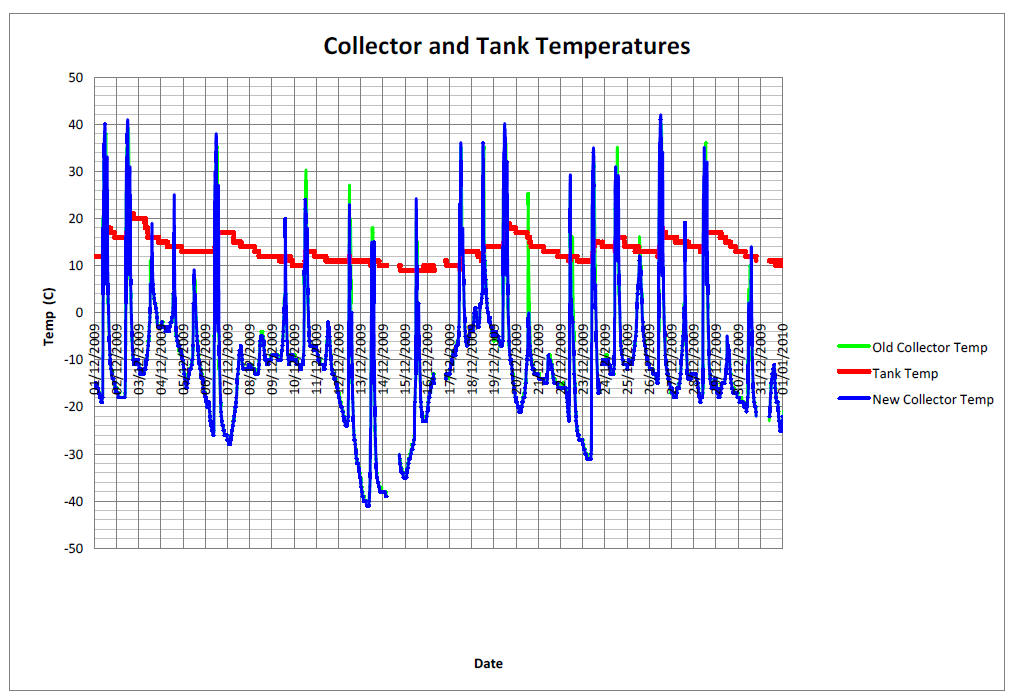
The dark period around the solstice was interesting. I really didn’t expect much
if any useable heat harvest, and I was right. The best daily tank temp rise was
5C. The most impressive day was Dec. 13th. The overnight low was –41C (ouch) but
the next day was clear once the ice fog burned off. The high outside temp for
the day was -30C, but the collector ran! Inside the collector it got to +20C,
which amazed me. On warmer days the collector temps got to +40C, which shows
less heat loss to the outside of the collector in warmer outside temperatures.
No problems with the drainback, either – I was quite happy with myself for
keeping steep (3% or more) angles on the collector tubes and the lines to the
basement.
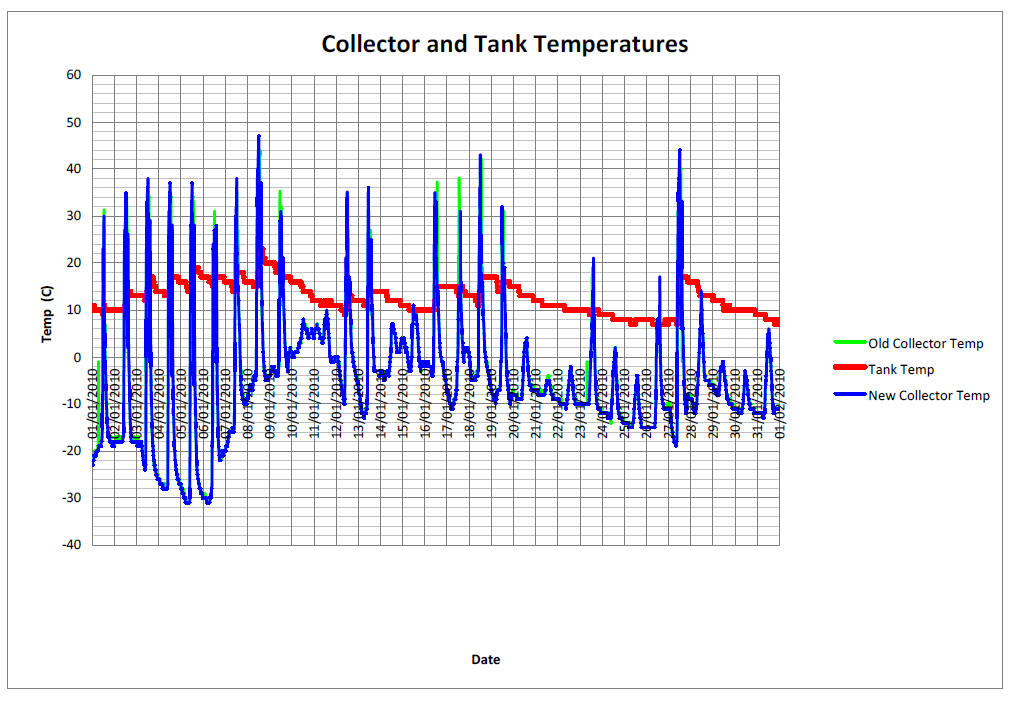
January was pretty quiet too. Reasonable performance at the start of the month
with a succession of sunny days, but dropping off to nothing in the second half.
A sunny day showing a 10C tank temp rise on Jan. 27th shows that the sun was
getting stronger a month after the solstice.
I also replaced my domestic hot water tank in January. My old tank was running
fine, but it was the original one, 25 years old, and there was a federal Home
Renovation Tax Credit program which gave a 15% tax credit for items like this.
It sounded like a good time for a planned replacement, as opposed to waiting
until it packed it in at some really inconvenient time. I debated about
instantaneous gas ones, but the midwinter performance of my solar system told me
that I would have to size an instantaneous one to cover all of our hot water
needs, and also account for very cold incoming water. For most of the year, this
would be oversized due to help from the solar system. So, the price scared me
away. The next option to consider was a higher efficiency storage type tank
(Energy Star rated). These are not too easy to find in our area; the big box
stores like Home Depot don’t carry them and I would have had to special order
one. So, I bought a regular tank locally and put an insulating jacket on it.
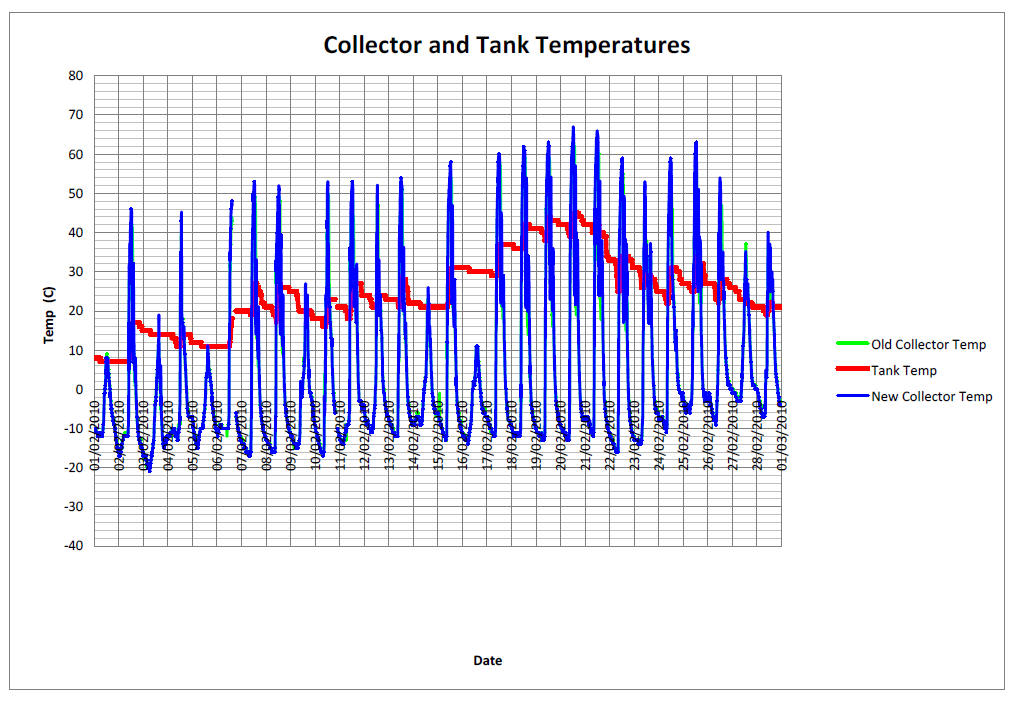
February was much better, going from a tank temp below 10C at the start of the
month to over 40C. The second half had record warm and sunny weather; the same
as what the Vancouver Olympics was getting. Due to the higher sun angle, the
maximum collector temps were over 60C.
So for the first winter, I am getting about what I predicted, maybe more. I am
looking forward to the summer months to see what performance I will get,
especially with the extra panel I installed in October.
Kevin
December 2009
Performance Update:
January 2010
Performance Update:
February 2010
Performance Update:
March 2010
Performance Update:
Kevin's solar water heating system
performance for March of 2010.

Hi Gary,
Here is a graph of March performance data to add
to the Nov-Feb ones I sent you a while ago.
March saw good performance. We were away for
over a week, and during that time the tank temp got up to 49C. Late in that
period, I lost the data logging sensor in the tank, so there is a gap in
tank temp data. It was one of the homemade ones I made by encasing a
DS18B20 sensor in epoxy, so I wasn't too upset.
Regards,
Kevin
Gary November 14, 2009, April 17,
2010