Solar Resource Maps

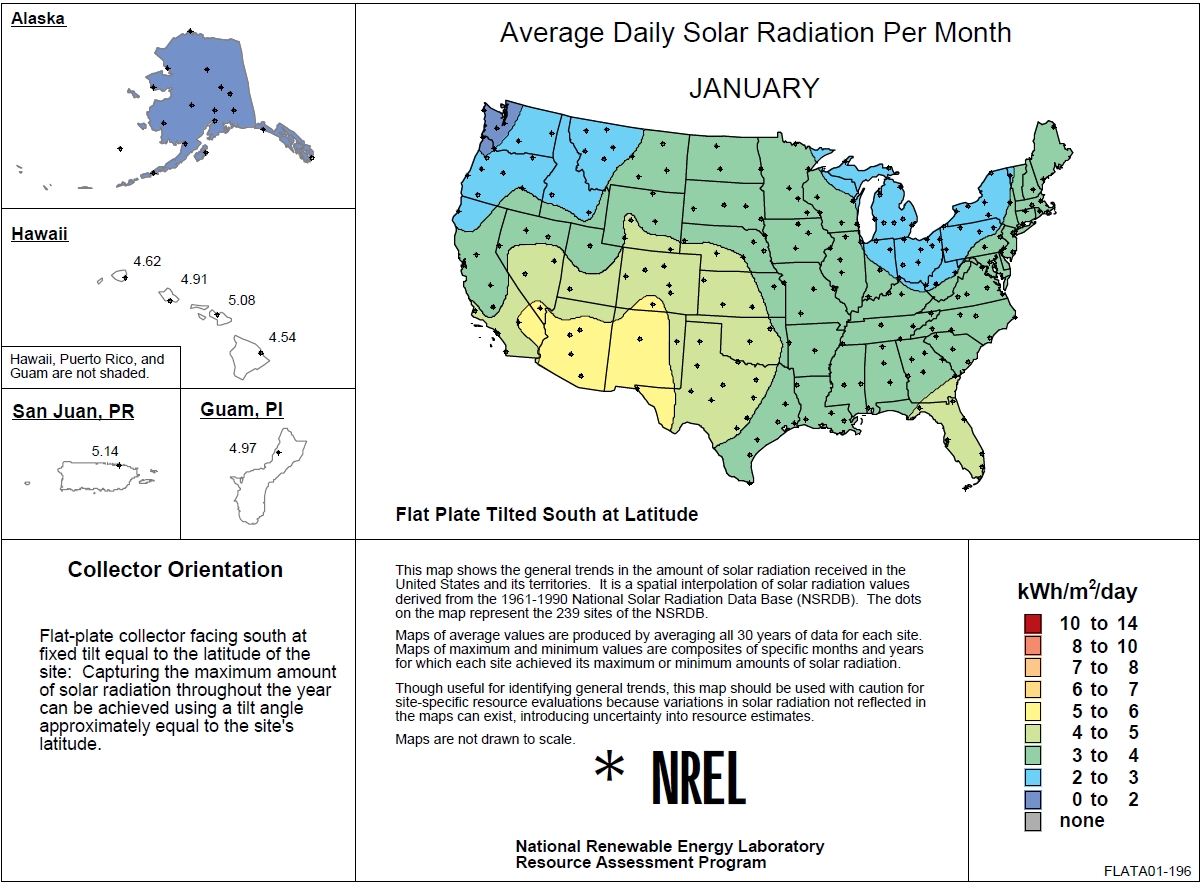
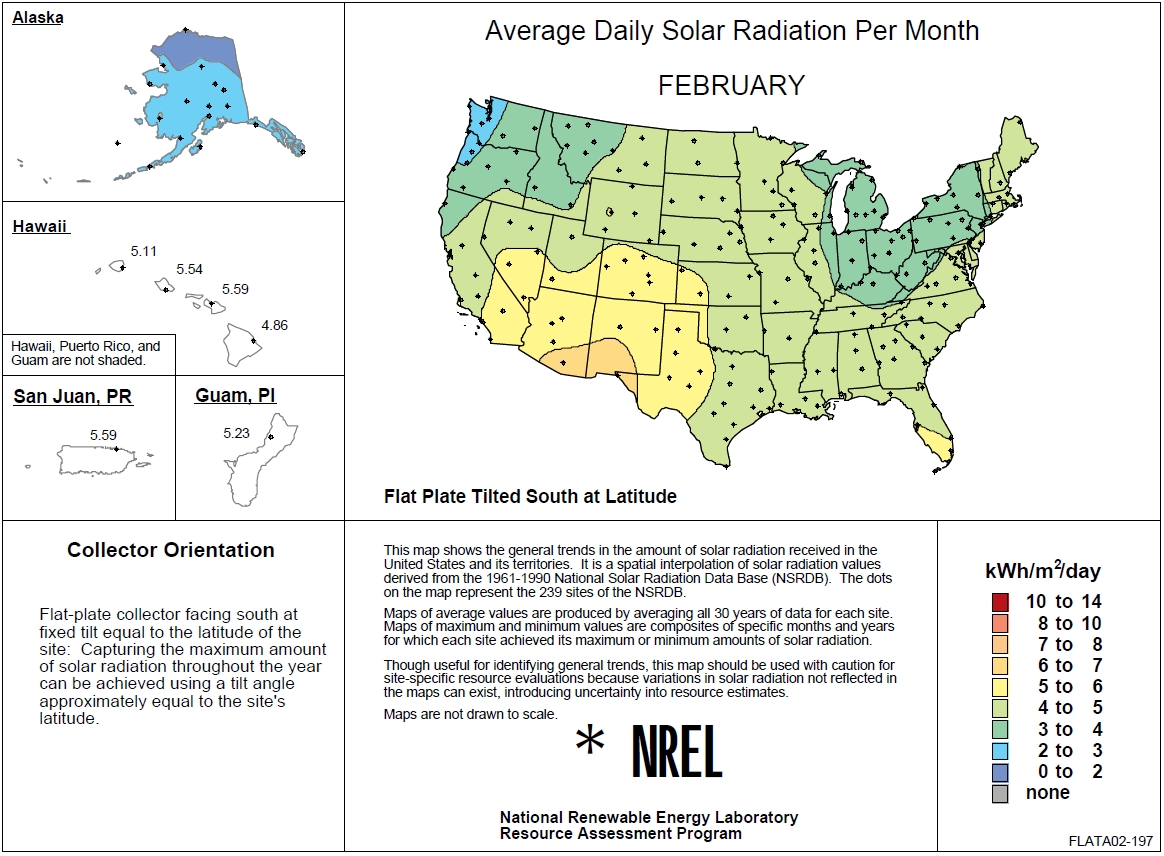
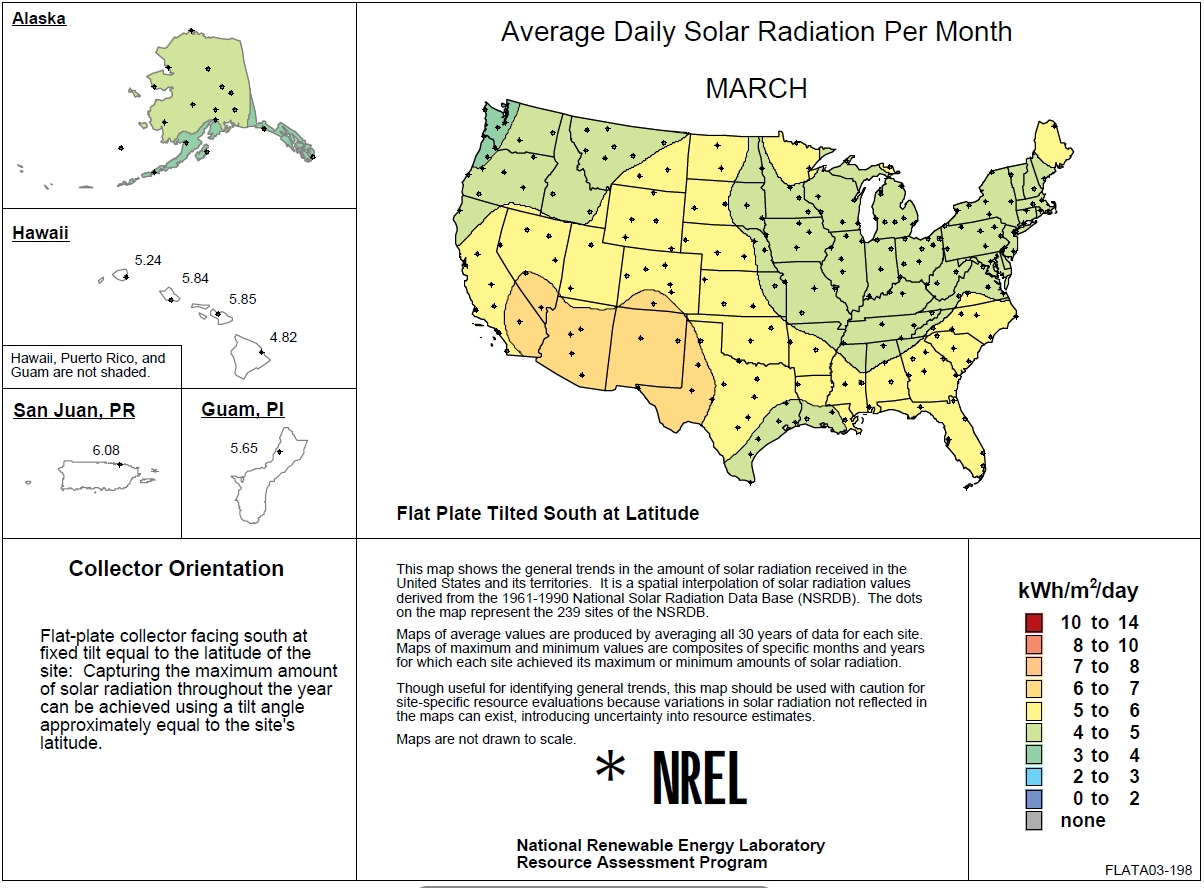
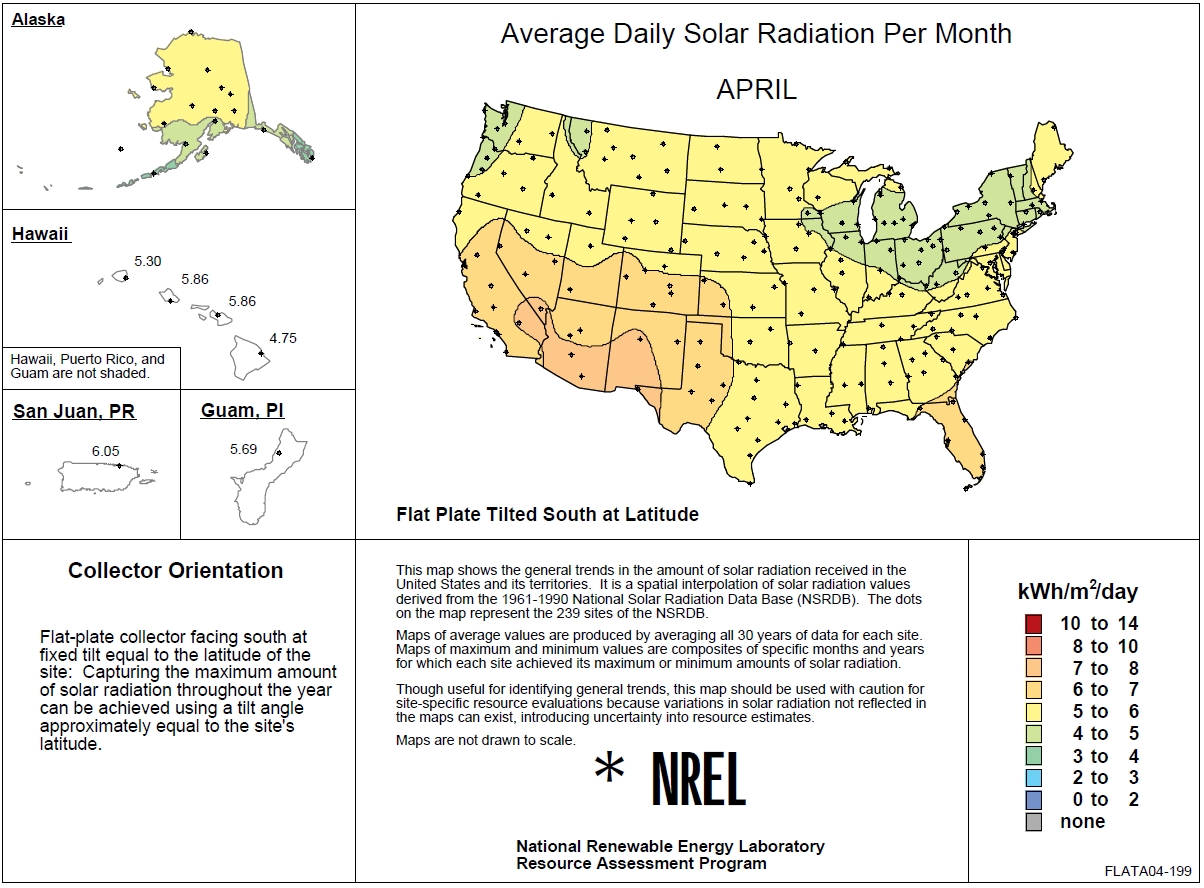
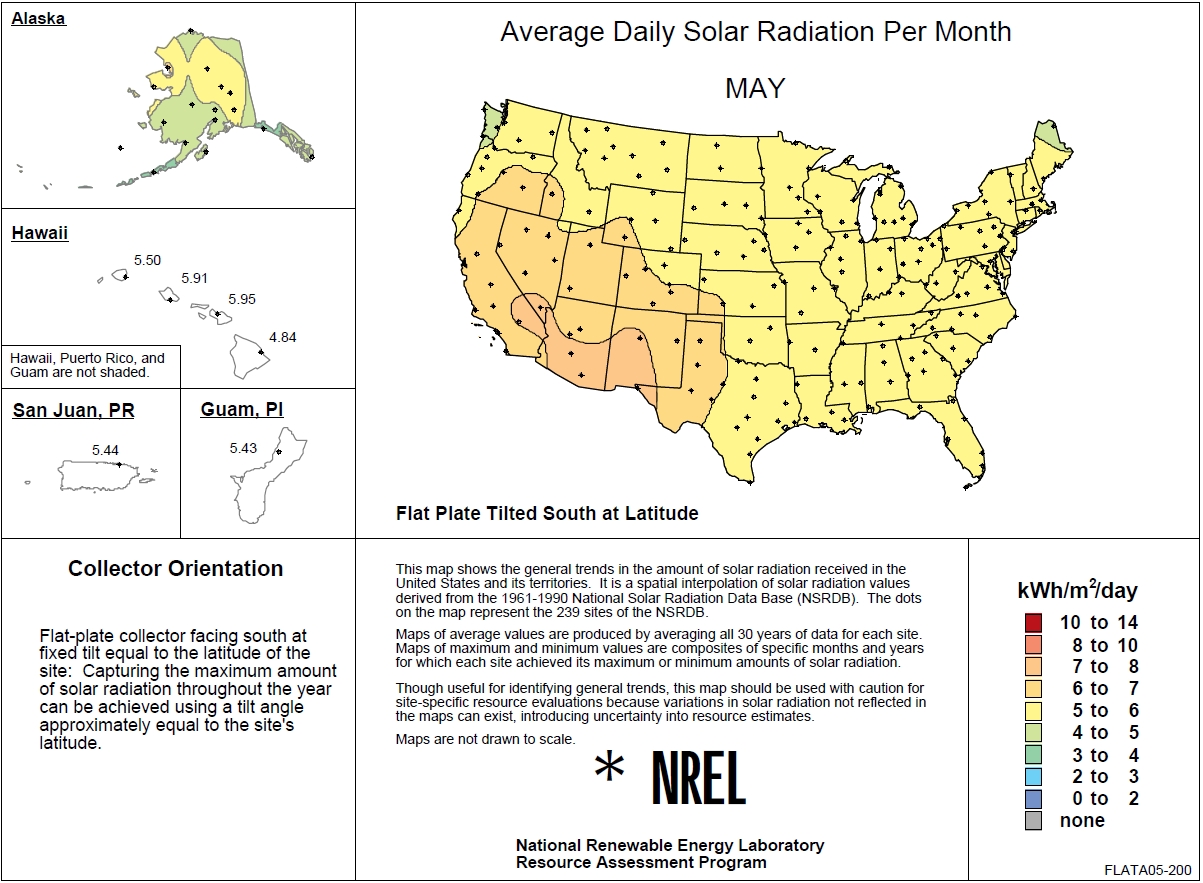
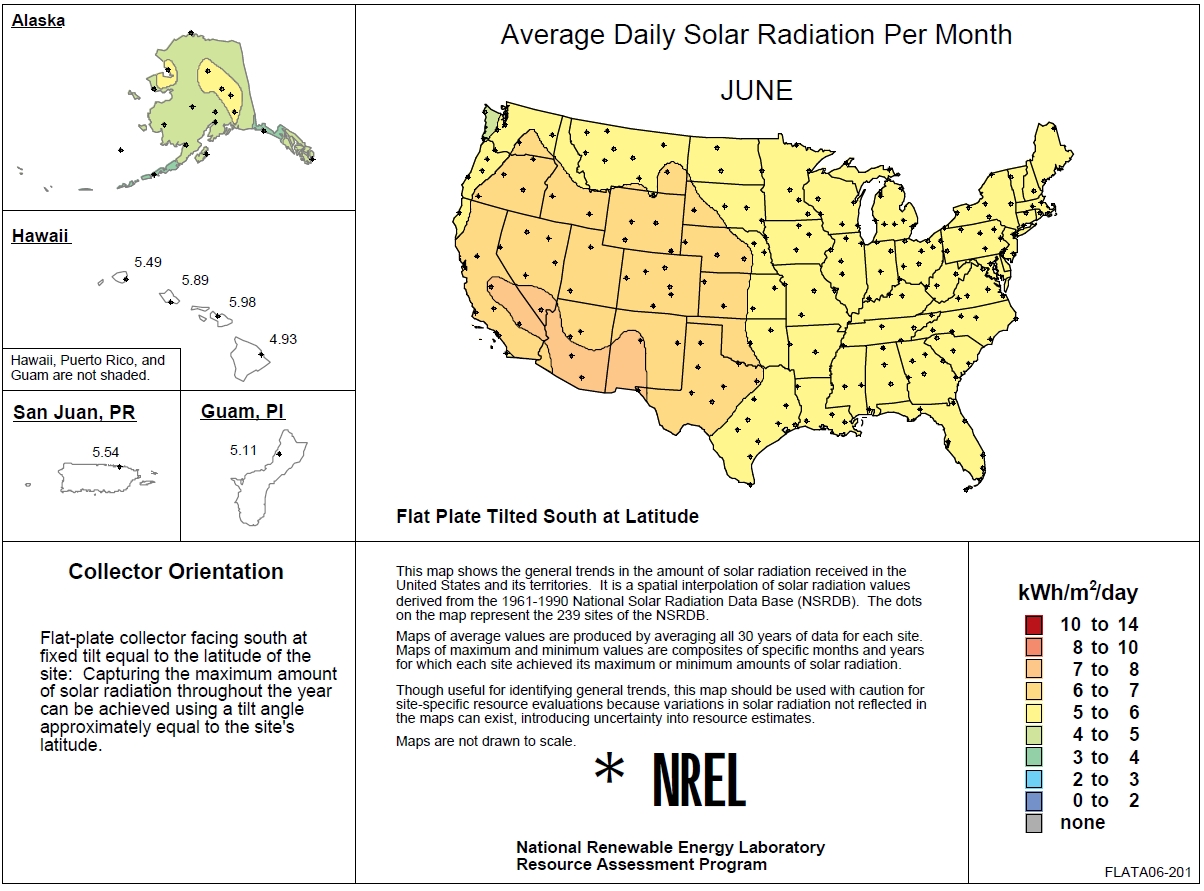
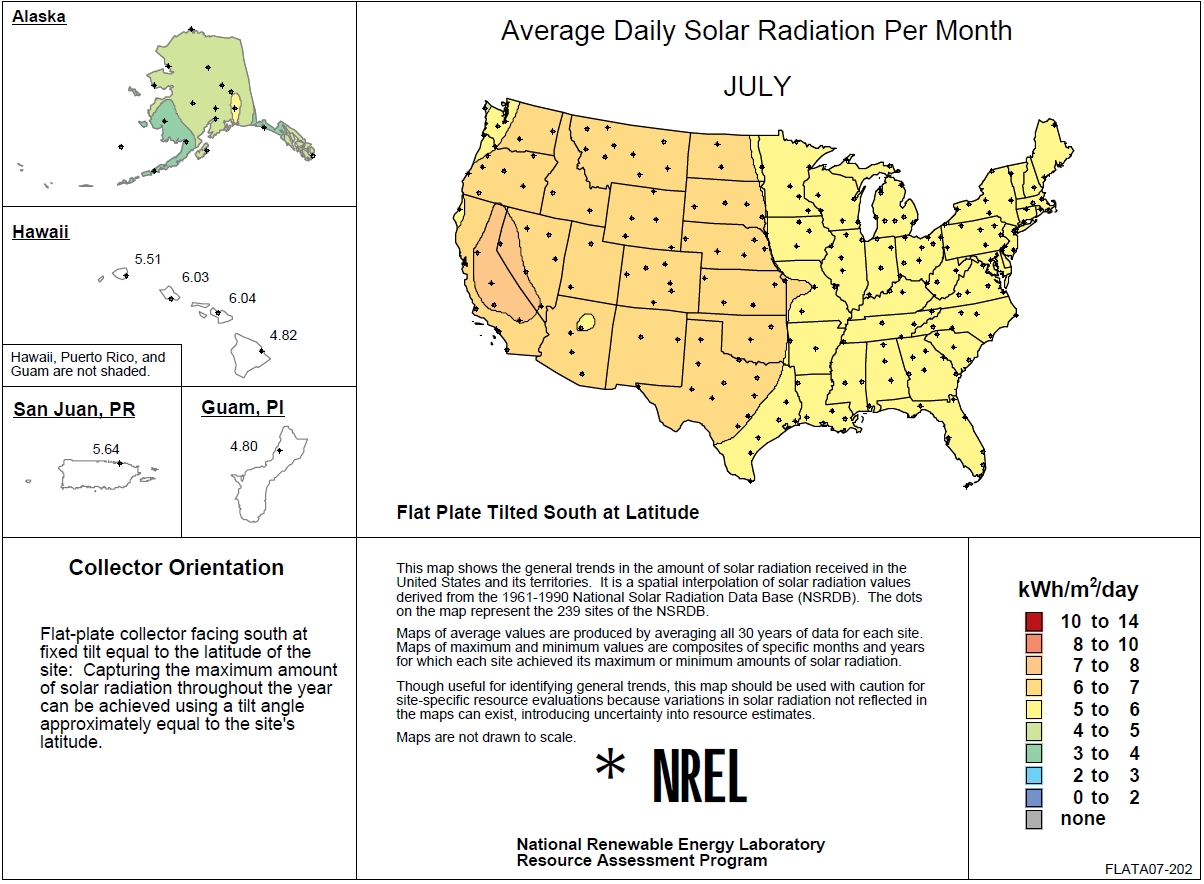
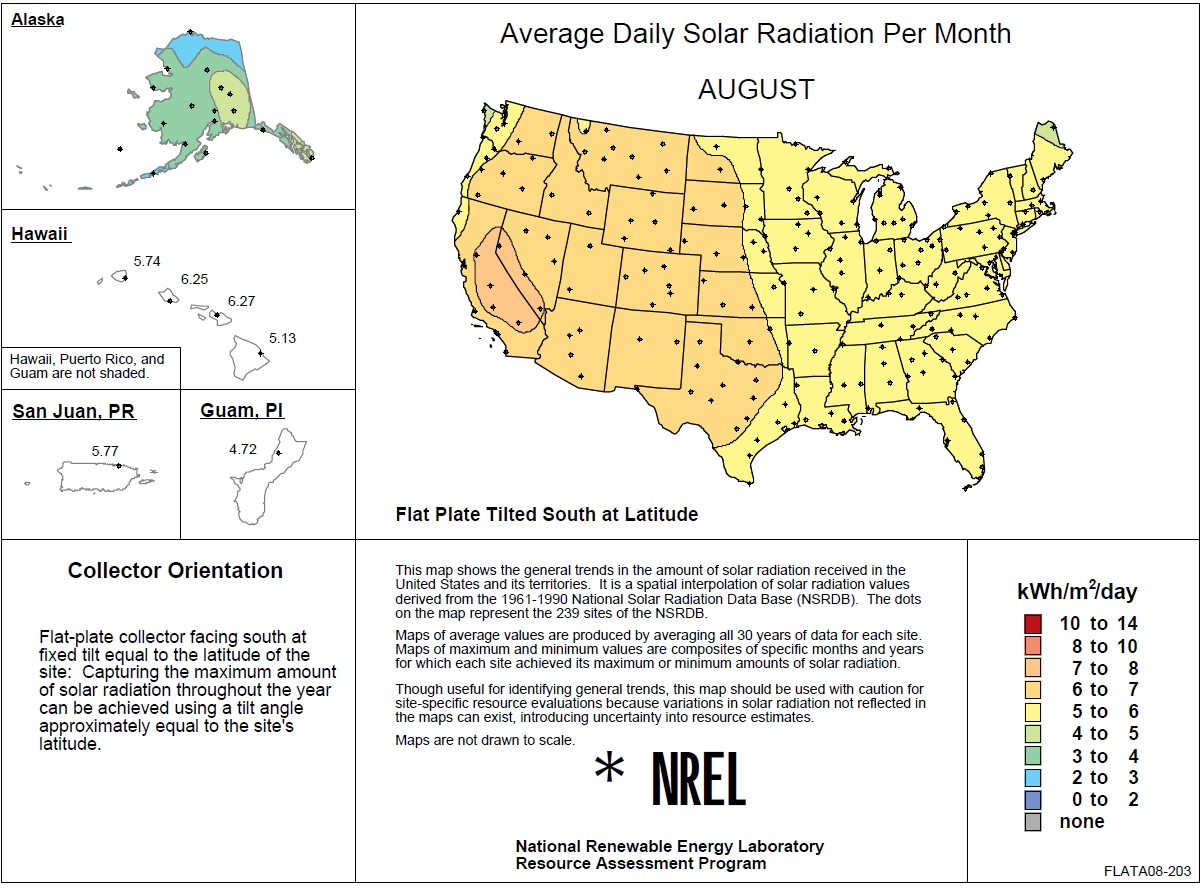
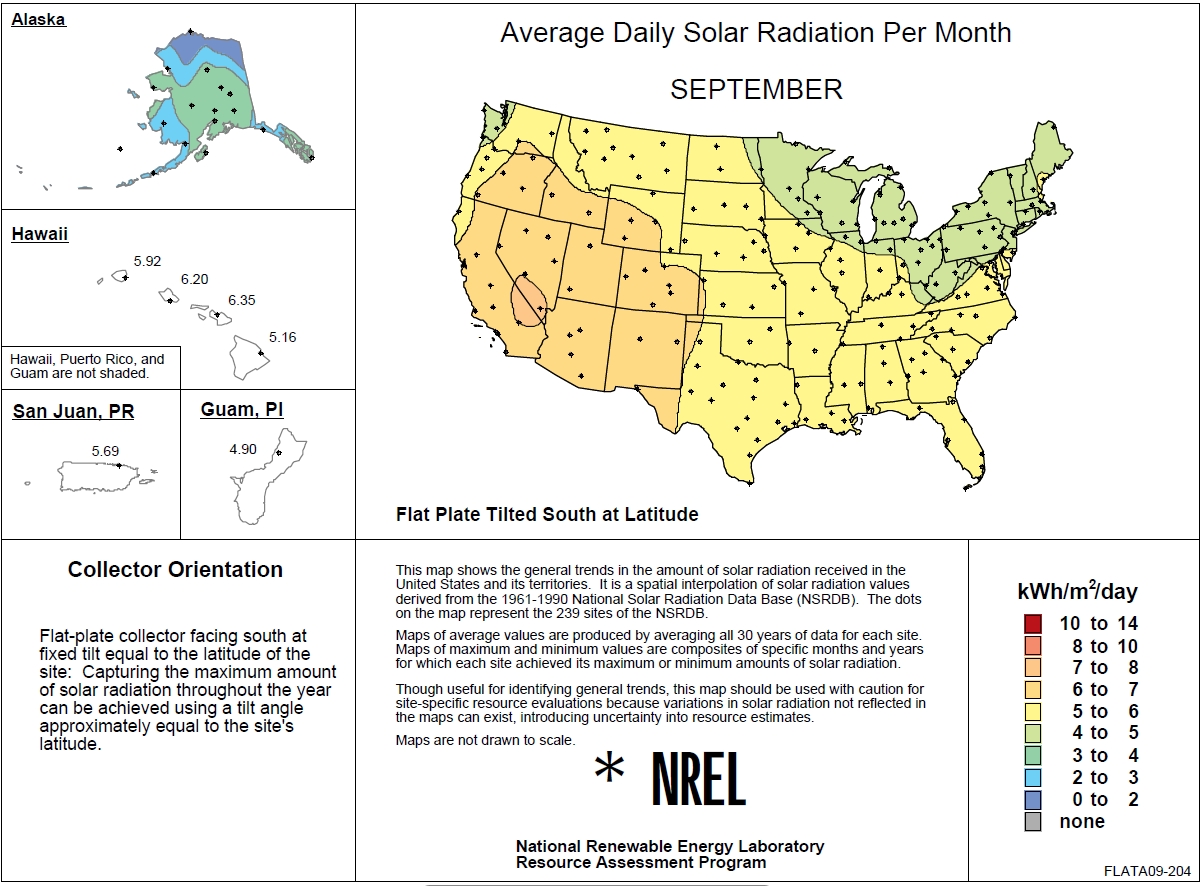
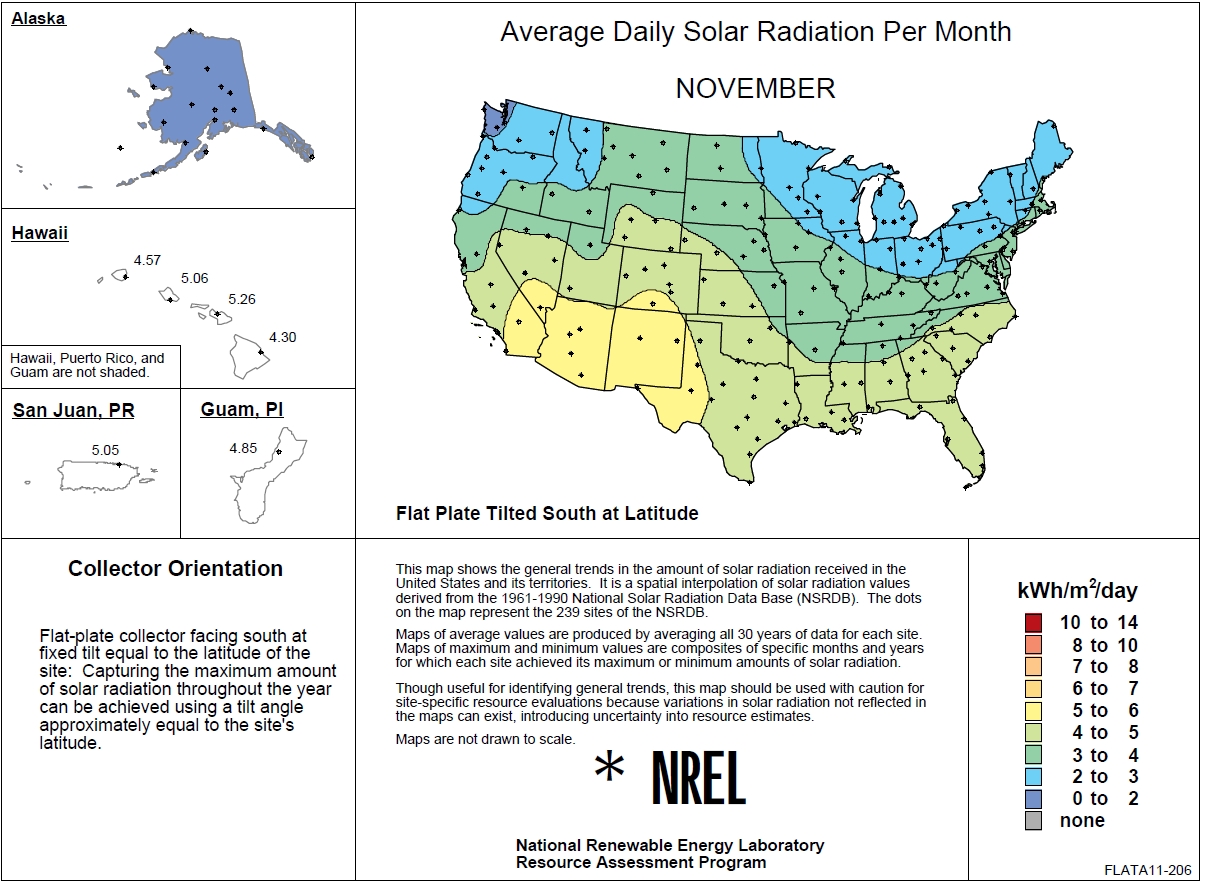
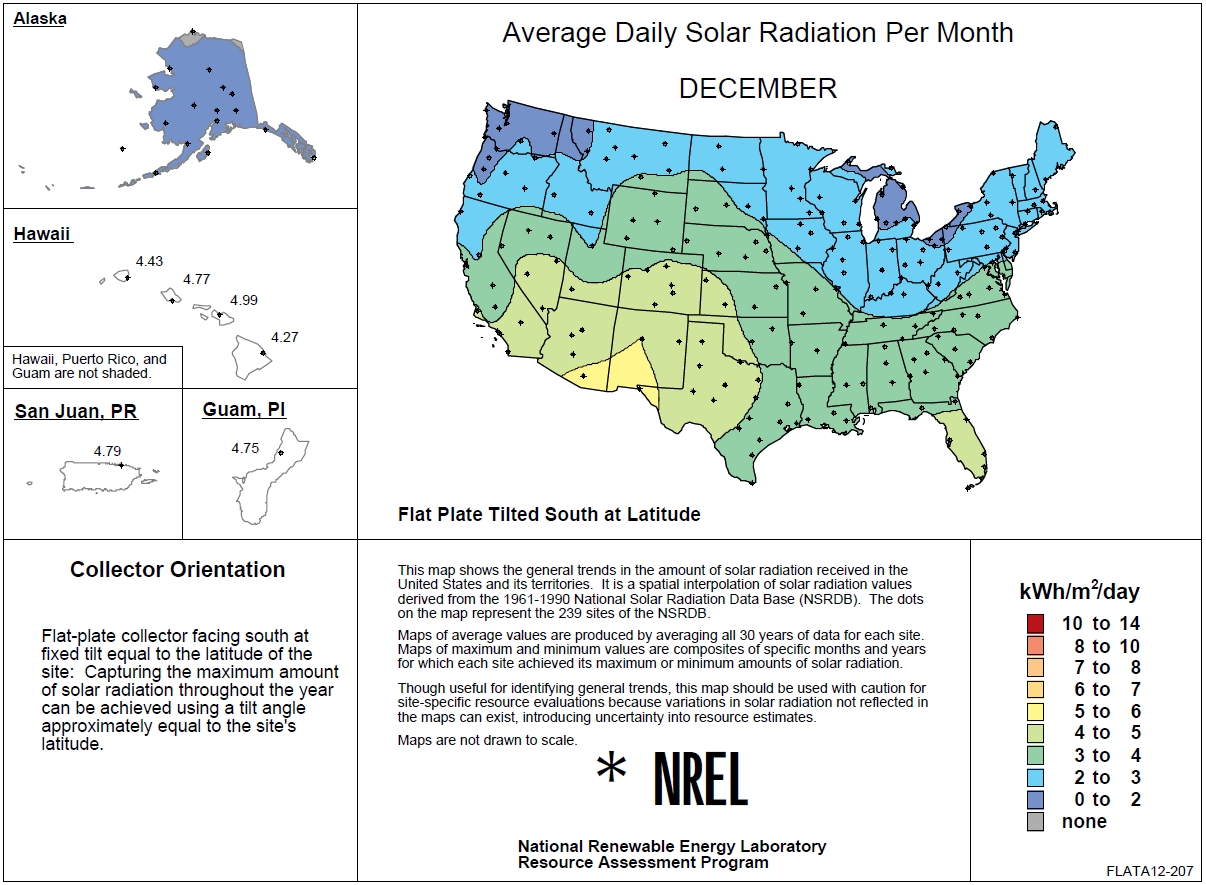
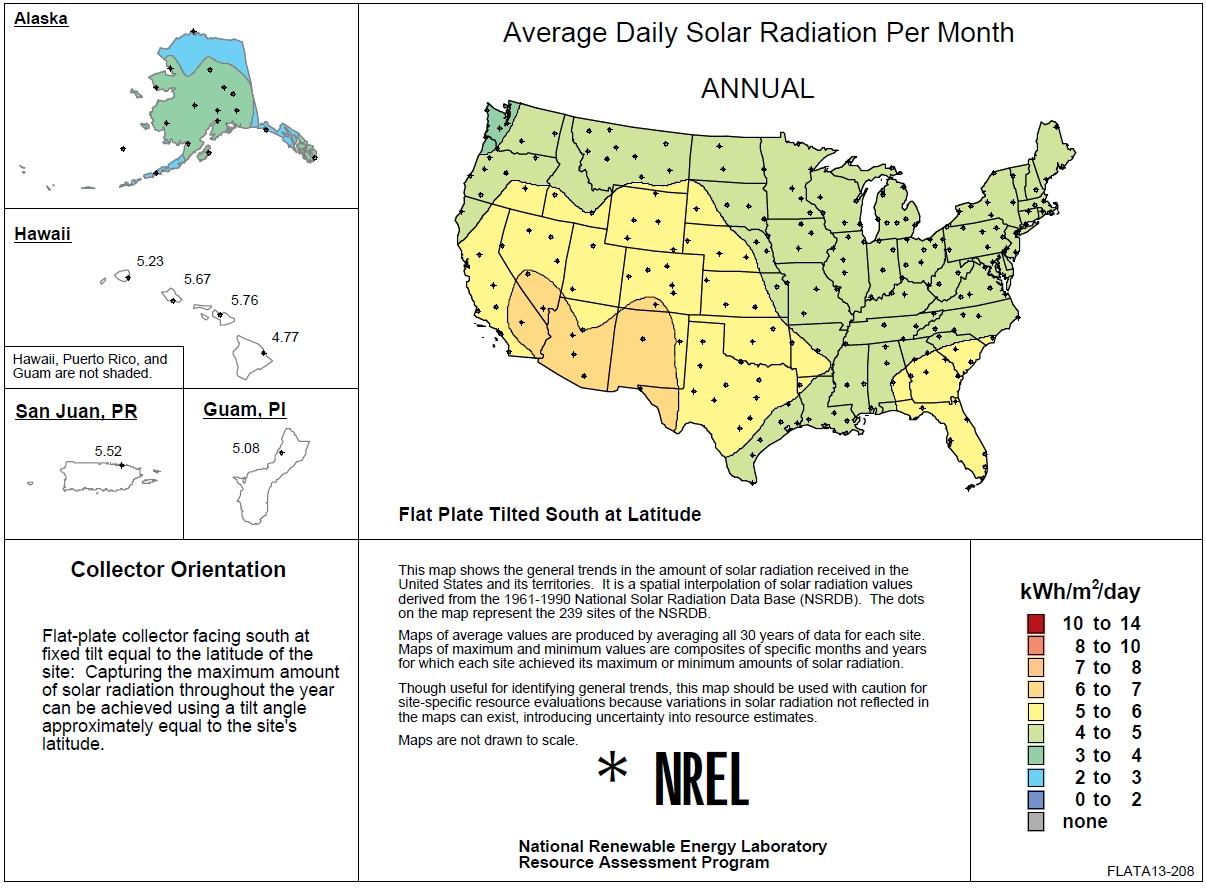
The maps below provide average solar radiation for the US for each month of the year and for the full year. The radiation levels are given in kilowatt-hours per sq meter of collector per day. That is, if the map shows a value of 6 for your area in May, that means that 6 KWH of solar energy fall on each sq meter of your collector on an average day in May.

These maps are for a fixed collector pointing south and tilted at the local latitude. This generally gives the highest year round incident energy. Maps for other tracked and fixed collectors at various tilts are availabe from NREL at the US Solar Radiation Rsource Maps page...

There are many ways to use this data -- I give some examples here...

- see the variation over the year in solar rad for your area (eg Bozeman)

- Compare different areas of the country (bring up heating season and solar resource)

- Do a rough estimate of solar energy that can be harvested (will need to bring in temperature and solar radiation)


January

February

Feb solar rad map

March

March solar rad map

April

April solar rad map

May
May Solar Rad map

June

June solar rad map

July

July solar rad map

August

August Solar Rad Map

September

Sept solar rad map

November

Nov solar rad map

December

Dec solar rad map


Annual

annual sol rad map