Performance Test of A Solar Air Heating Collector Using an Aluminum
Downspout Absorber
This is a side by side heating performance test comparing a solar air
heating collector that uses aluminum gutter downspouts for the absorber to a
collector that uses two layers of black screen for the collector. The
test is part of this solar air heating collector
test program.
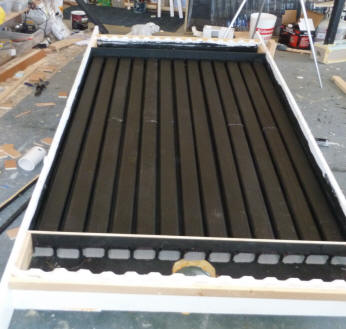
The construction
of the collector with absorber made from aluminum gutter downspouts is
described here...
The
construction of the collector with absorber made from two layers of black
screen is described here...
Back to the Solar Air
Heating Collector test program home..
The screen collector used in this test is the one with two layers of
black fiberglass screen. I like the two layers of aluminum screen
better because the FG screen tends to outgas and leave a coating on the
inside of the glazing, but with the glazing clean, I believe the thermal
performance of the alum and FG screens are the same.
Basically, the two collectors are the same size and construction with the
exception of differences in the absorber construction. The collectors
are tested side by side so that they both experience the same sun exposure,
ambient temperature, and wind conditions. Hopefully any differences in
performance are due only to the difference in absorber construction.
Test Setup
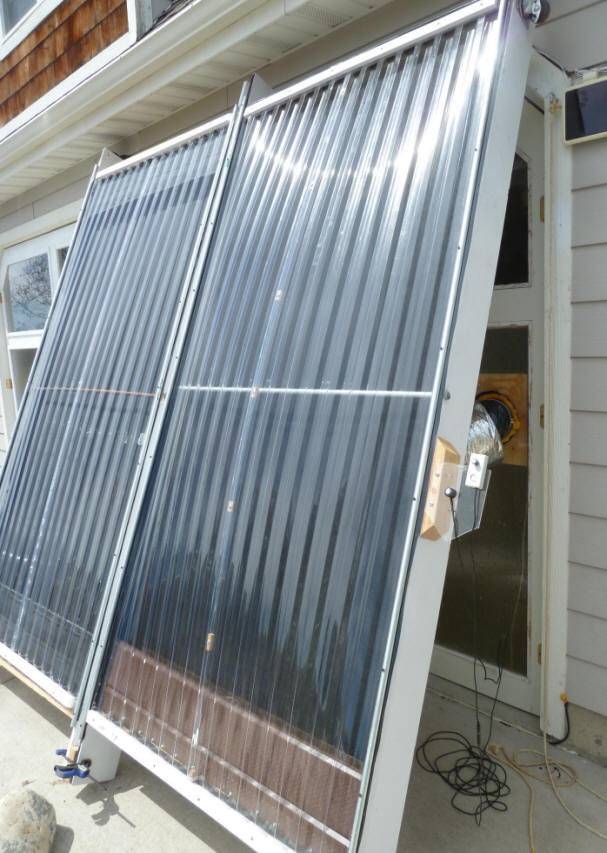
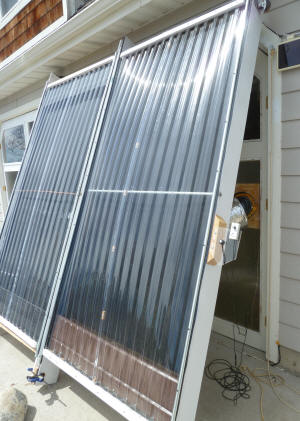
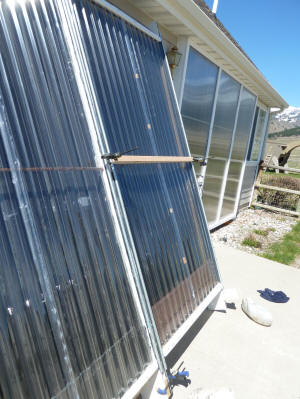
The two collectors are set up side by side just outside my shop.
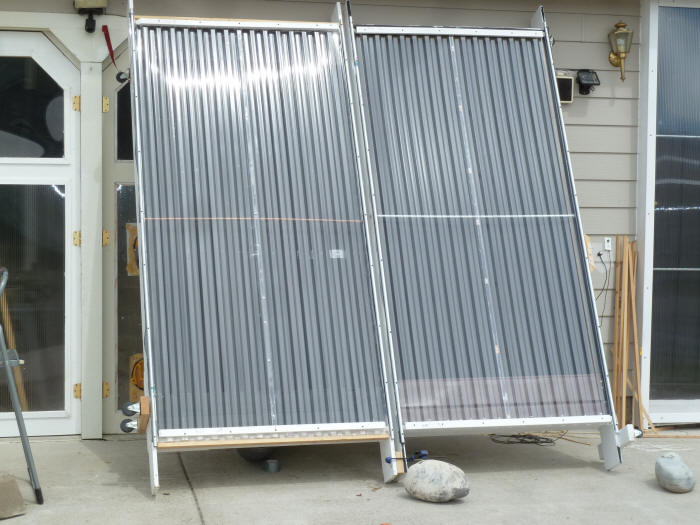
Downspout collector on left and screen collector on right.
The inlet and outlet ducts are run back to the shop. Each duct is
about 10 ft long. The ducts are 6 inch diameter, insulated plastic
ducts as are commonly used in home heating applications.
The blower setup is as shown just below. The blowers are
Elicent
AXC
125B, 5 inch diameter.
I taped all the joints and in general tried hard to minimize leaks in the
ducts and collectors.
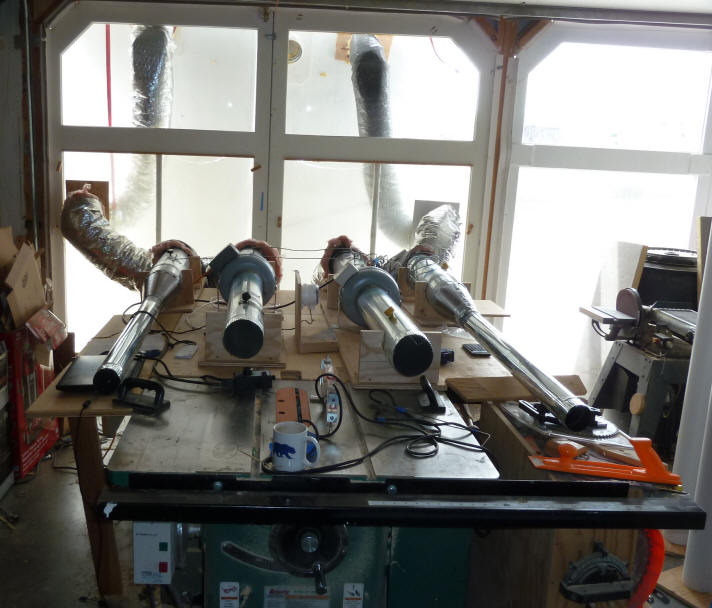
The blower setup -- right blower and ducts for downspout col, and left
blower and ducts for screen collector.
The flow was adjusted on both collectors to be about 3 cfm per sqft of
collector, or about 90 cfm (this varied a little from test to test, but in
all cases the flow was adjusted to be the same for the DS and screen collectora).
In this test I tried a new setup to measure flow rates and to try and get
the same flow in each collector -- the latest step in what seems like an
endless quest to get some air measurements that I can really feel are
consistent, accurate and reliable.
I picked up a pair of matched, small diameter Dwyer pitot tubes along
with the worlds fanciest tilted oil manometer on EBay for a song. I
used these to measure the air velocity in the 3 inch diameter tubes. I
reduced the tube diameter from 5 inches fan inlet/outlet diameter down to 3 inches in order to get the
velocity up into the range that allows more precise pitot tube velocity
measurements.
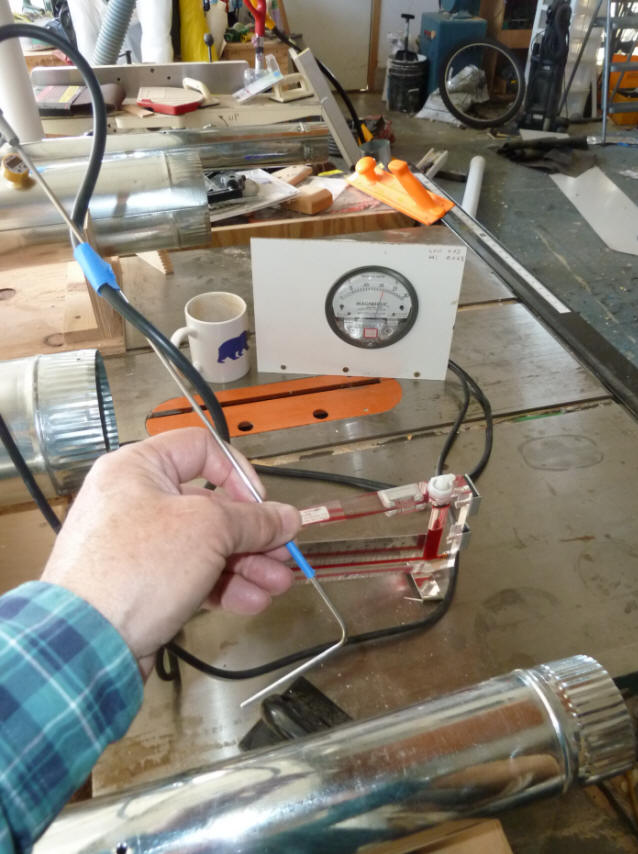
One of the pitot tubes. The oil manometer (with the red oil) or the
pressure gage in the back are used to measure
the pitot tube velocity head. A lookup table is then used to look up the
corresponding velocity.
This is also the first time I used a motor speed control to adjust the
flow rate. I put the motor speed control on the blower that was
producing the higher flow rate of the two and adjusted it down until it
matched the other collector. This worked quite well, and was easier
than using the dampers -- but, the adjustment range was not too large.
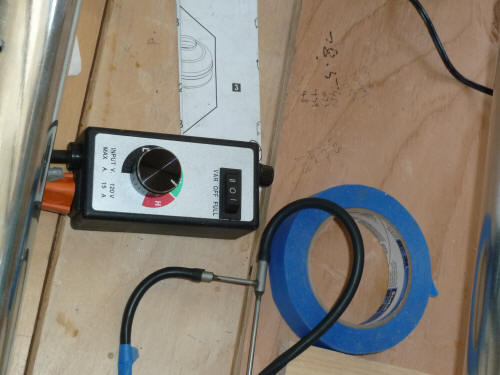
Blower speed control ($23)
I do feel that this setup can be the basis for good accurate flow
velocity measurements, but I need to refine some of the details like a
smoother tapered section to get down to 3 inches, a more precise pitot tube
holder to position it in exactly the same position in the duct, and also
have to do a velocity survey across the diameter in order to be able to
correct the centerline velocity into an average velocity across the duct --
all to be put off until fall.
At this point, I believe that the pitot tubes as used in this test are good
for setting the flow equal in each collector -- I'm less sure about the
accuracy of the velocity and flow measurements.
Performance Results
I should point out upfront that the ambient temperature for the test day
was 49F. This is higher than I would have liked, and is not typical of
winter heating conditions (at least not in Montana). But, its hard to
believe that the efficiency curve slope is so much different on these two
collectors that a 10F cooler ambient temperature would change the relative
performance of the two collectors substantially.
The flow through the two collectors was adjusted to as close as equal as
I could get with the setup described above. The total flow for each
collector was about 87 cfm or, 2.9 cfm/sf.
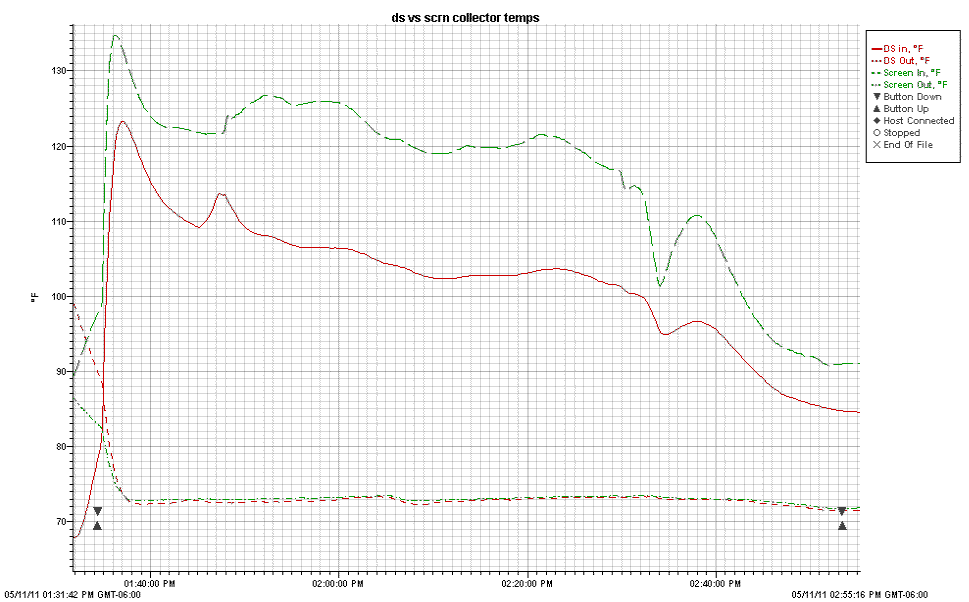
So, the screen collector produces a significantly larger (better)
temperature rise than the downspout collector. In the first part of
the test, the screen dT is about 47F vs 30F for the downspout -- about
50% greater heat output. In the last part of the test, the
screen dT was about 20F vs 14F for the downspout -- about 43% greater heat
output for the screen.
I did the first part of the test (1:30pm to about
2:30pm), and then went out to take a final look at the collectors and noted
that the glazing on the screen collector was bulging out quite a bit due to
the pressure in the collector. This is likely due to the 3 inch
diameter section I added to measure the flow velocity in causing more back
pressure in the collectors. It was bulging enough that the
glazing to screen distance was effected, so I clamped a wood 2 by 2 across
the center of the glazing to push the glazing back in. The part of the
test after 2:50pm ish is with this clamp board in place. Its
interesting that it reduces the temperature difference between the two
collectors -- so maybe it is saying that the screen collector is more
efficient with more spacing between the screen and the glazing -- not too
surprising.
Bulging glazing on screen collector.
Note that in spite of the big bulge, I could not detect
any air leakage around the edges or top. |
Glazing clamped back to flat with 2 by 2. |
The performance of the DS collector is both surprising and disappointing,
as it seems like DS collector design has a lot going for it, and that it
should do better.
I need to point out that the the flow distribution in the downspout
collector has not been optimized to try to get equal flow in all of the
downspouts. This flow distribution
test on the downspout collector shows quite a bit of variation in the
flow between the center downspouts (low flow) and the outer edge downspouts
(higher flow). Its quite possible that with some optimization of the
inlet and outlet manifolds that the distribution could be improved and this
should improve the performance of the DS collector. I'm not convinced
that getting an equal flow to each downspout is an easy thing to accomplish,
and I don't know how you know when you are there (short of actually
measuring the flow in each downspout).
I did do a test in which the air was being sucked out the top of each
collector, which in the earlier test resulted in a more even flow
distribution for the ds collector. The results for the two collectors
were closer with the screen collector still quite a bit better, but I had some
conflicting airflow measurements and I'm not certain the flows were the same
in both collectors, so I'm not showing those results.
I would like to retest the DS collector next fall after trying to get the
even flow distribution issue straightened out -- any ideas on other
improvements would be appreciated.
IR Images of Glazing
This section looks at the thermal images of the glazing for the two
collectors as a way to possibly get some insight into why the DS collector
is not doing better. As Scott suggested, there are only really two
places for the incoming solar to go -- the first is as useful heat to the
room being heated, and the 2nd is as heat heat loss out the glazing
(there will be losses from other parts of the collector, but these should be
small).
Since heat loss from the glazing is proportional to how much temperature
difference there is between the glazing and the air, the thermal images
should give an idea of the glazing heat loss pictures -- hotter glazing
areas are losing more heat.
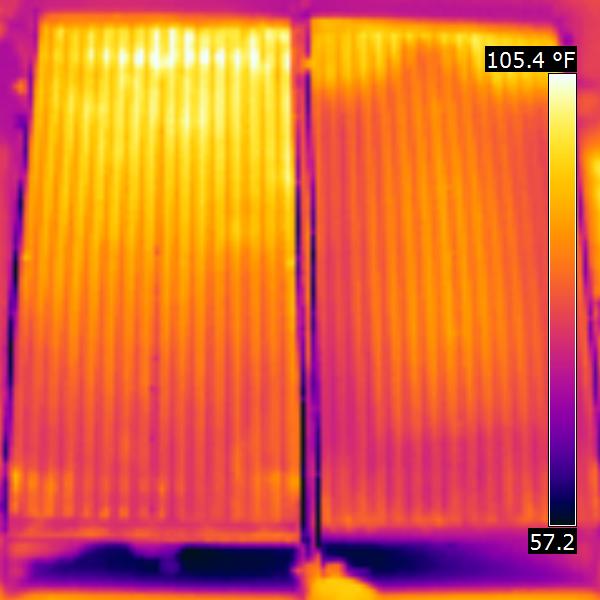
This is the basic thermal image with downspout collector on left and
screen collector on right.
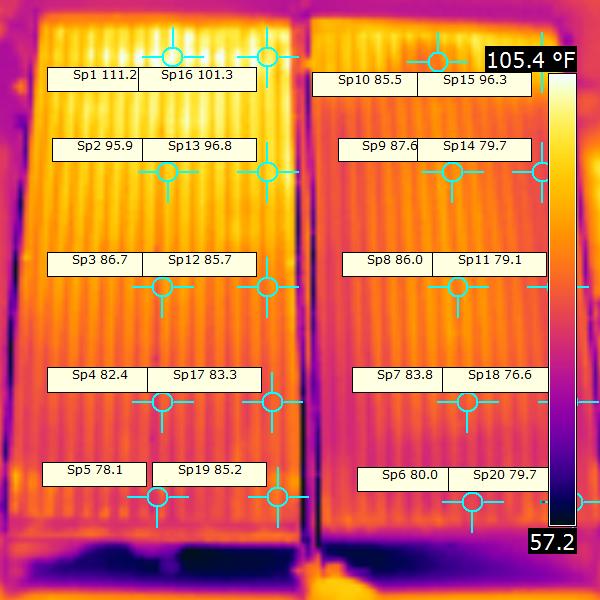
Same image with some temperature labels for a few equivalent places on
both collectors.
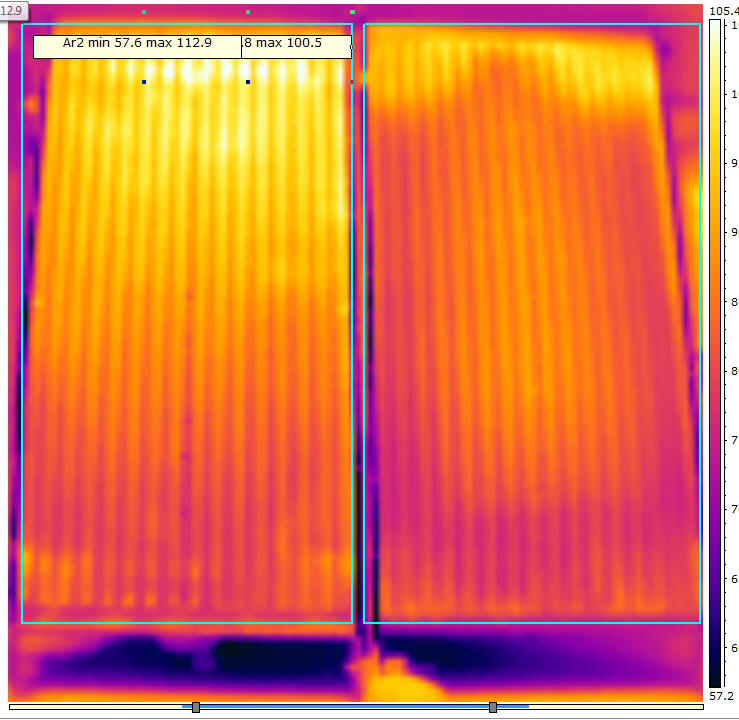
This picture shows the two boxed areas that were used to calculate the
average temperature of the full sheet of glazing for each collector.
To get an idea what the average glazing temperature for each collector
was, I defined an area on the thermal image using the camera software, and
then exported the temperatures from within that area to Excel, then used the
Average function in Excel to calculate the average temperature for the full
boxed area. The average temperature for Screen absorber glazing =
82.4F, and the average temperature for downspout absorber glazing = 87.1F.
Because of the way the pictures were taken, I could not get an exact
rectangle that just fits the collector, but they are pretty close and the
error on both is to take in a bit of cooler area.
So, its pretty clear just from looking at the first picture that the DS
collector glazing is running hotter. So what are the details of the
Physics going on here that makes this happen?
| |
These calcs just see if the glazing temps vs collector heat loss
and gain seem to make sense...
The ambient temperature was about 49F, so the Screen temperature
glazing delta Temp was (82.4 - 49) = 33.4F, and the downspout
collector delta Temp was (87.1 - 49) = 38.1F. This would tend
to indicate that the heat loss from the DS collector is (38.1/33.4)
= 1.14 times that of the screen collector. This does not
exactly match up with the difference in heat output estimated from
the logged flowrates and temperatures, it is at least in the right
direction.
If you estimate the rough heat loss of the glazing using:
Glazing Heat loss = (Area)(Tglaz - Tamb) / (Rairfilm)
Rairfilm for still air is 0.65, Rairfilm for
a 7.5mph wind is 0.25,
I'll use R = 0.4 to account for some light wind and air currents due
to convection, and the extra corrugation area of the SunTuf (just a
guess)
Glazing Heatloss screen = (32sf)(33.4F) /
(R0.4) = 2672 BTU/hr
Glazing Heatloss DS = (32sf)(38.1F) / (R0.4)
= 3048 BTU/hr
This compares with the heat output of screen collector of about
(87cfm)(0.065 lb/cfm)(60min/hr)(120F - 73F)(0.24 BTU/lb-F) = 3830
BTU/hr, and the Ds collector (87)(0.065)(60)(104-73)(0.24) = 2520
BTU/hr.
|
Collector Pressure Drop:
The pressure drop for the two collectors:
| |
Total pressure drop
with ducts |
Duct pressure drop
alone |
Collector pressure drop alone |
| Downspout
Collector |
0.31 |
0.132 |
0.178 |
| Screen Collector |
0.322 |
0.132 |
0.19 |
All of these are measured in inches of water.
All of the pressure drops are measured with a flow rate of about 3 cfm
through the collectors.
Note that these were made when the screen collector had the bulged out
glazing -- clamping the glazing back to flat increased the screen collector
pressure drop to nearly equal to the ds collector.
The total inlet duct length was about 10 ft of the 6 inch flex duct with
some bends plus about 3 ft of galvanized metal 6 inch diameter duct.
The outlet duct was essentially the same length.
So, there is a bit of a lesson here -- about half of the total pressure drop
was the supply and return ducting, and these ducts were relatively large in
diameter and relatively short.
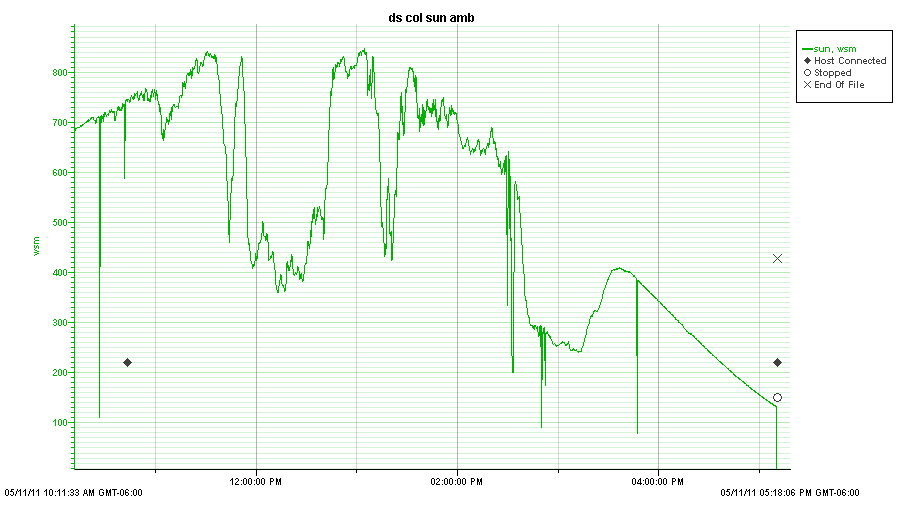
Sun Levels
This is the plot for the sun levels for the full test as logged on the
Apogee pyranometer.
Gary May 14, 2011