Search
The Renewable Energy site for Do-It-Yourselfers
Deep Mesh Solar Air Heating
Collector -- Test 1
|
Nick Pine describes a solar home heating concept using solar air
heating collectors that is aimed at producing a very high solar fraction
with relatively inexpensive solar air heating collectors. In order
to accomplish the high solar fraction, the system must include several
days worth of heat storage for extended cloudy periods -- a large
storage capacity.
The physical size of this large heat storage depends on the maximum
temperature that the storage can be raised to -- higher temperatures
store more heat in less space. But, producing higher temperatures
normally means that the solar air heating collectors would operate less
efficiently as the losses out the collector glazing go up with collector
temperature -- thus the desire for high storage temperatures can result
in an undesirable increase in collector area.
There is a potential collector design that may produce the desirable
higher collector temperatures at good efficiency. This design uses
several layers of mesh for the absorber. The advantages are said
to be: 1) the pressure drop caused by the mesh spreads the airflow
evenly over the full surface of the absorber, and 2) the first layer of
mesh acts as a radiation shield to reduce the radiation from the hotter
inner layers toward the glazing. The first layer of mesh runs
relatively cool in part because in this heating scheme, the air
introduced into the collector is relatively cool (70F) room air -- this
cooler first layer of mesh thus reduces losses out the glazing.
So, in an ideal design, 70 F room temperature air is introduced
between the glazing and the first (north most) layer of mesh. This
coolish air spreads evenly over the full mesh surface because of the
mesh pressure drop. Even though the airflow rate is low (to
achieve higher temperatures), the first layer of mesh runs at a low
temperature because of the relatively cool 70F air, and the ability of
the mesh absorbers to provide very even airflow over the full surface.
As the air progresses through the layers of mesh, it heats up, and since
flow rate is low, the residence time is long and the air heats up to
high temperatures (say 140+F). This hot air is then passed
through an air to water heat exchanger and the hot water produced goes
to heating the heat storage. By using the hottest air to heat the
storage, the max storage temperature can be higher and it can store more
heat. The still warm air leaves the heat exchanger and is blown
into the house for immediate space heating.
A key element in making this scheme work is the low flow, deep mesh
collector that operates efficiently while producing high temperatures.
This test is a starting point in trying to see if this can be
accomplished in a collector that is straight forward and inexpensive to
build. My standard air heating collector which has just 3 layers
of aluminum screen mesh is the starting point. The idea is to see
how well it does in achieving the high temperatures AND high efficiency,
and to identify changes that might make it do better, and possibly test
those.
|
|
The Collector
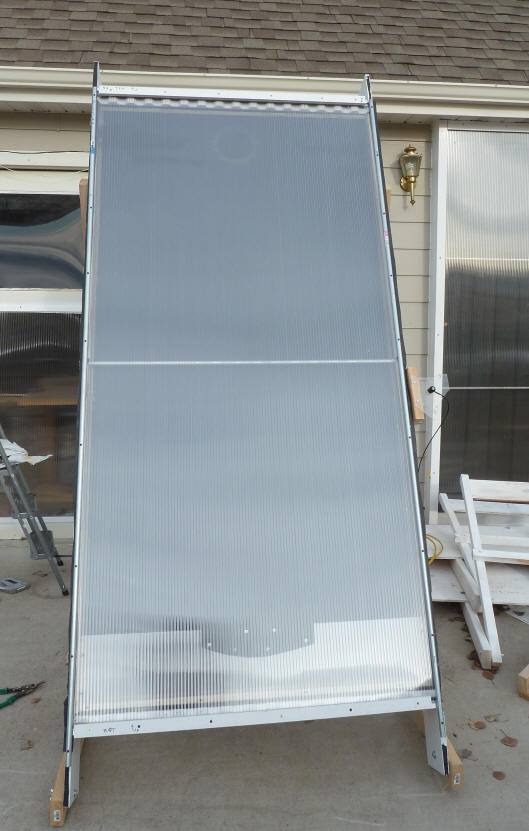
The collector used for the test is 4 by 8 feet. Glazing is 10mm thick
twinwall polycarbonate. The absorber is three layers of black aluminum
insect screen -- the layers are spaced 3/8 inch apart. The absorber is
tilted such that it is furthest from the glazing at the bottom and closer to the
glazing at the top. The back insulation is 2 inch polyisocyanurate painted
black on the south surface. The inlet is at the center bottom of the
collector -- all of the air is introduced on the glazing side of the absorber.
A full width deflector keeps the inlet air from impinging directly onto the
glazing and (hopefully) spreads the air out over the full width. The exit
vent is at the top center. The exit vent is on the north side of the
layers of mesh, so that all of the air has to pass through all layers of mesh to
get from inlet to outlet. Both vents are 6 inch diameter circles.
The top and bottom of the twinwall glazing is taped over with aluminum tape to
prevent airflow through the internal channels.
The collector is much like this one... The differences being the
twinwall glazing, and some changes to the airflow deflector at the inlet.
Some pictures:

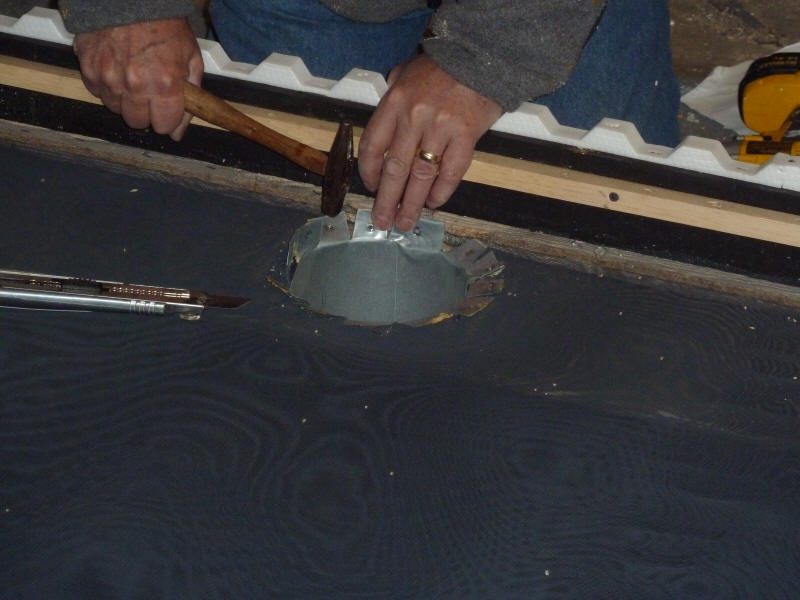
Inlet duct being fastened down over
the 3 layers of screen. |

new entry deflector made from twinwall
with center metal deflector to keep air
from short circuiting up the middle. |

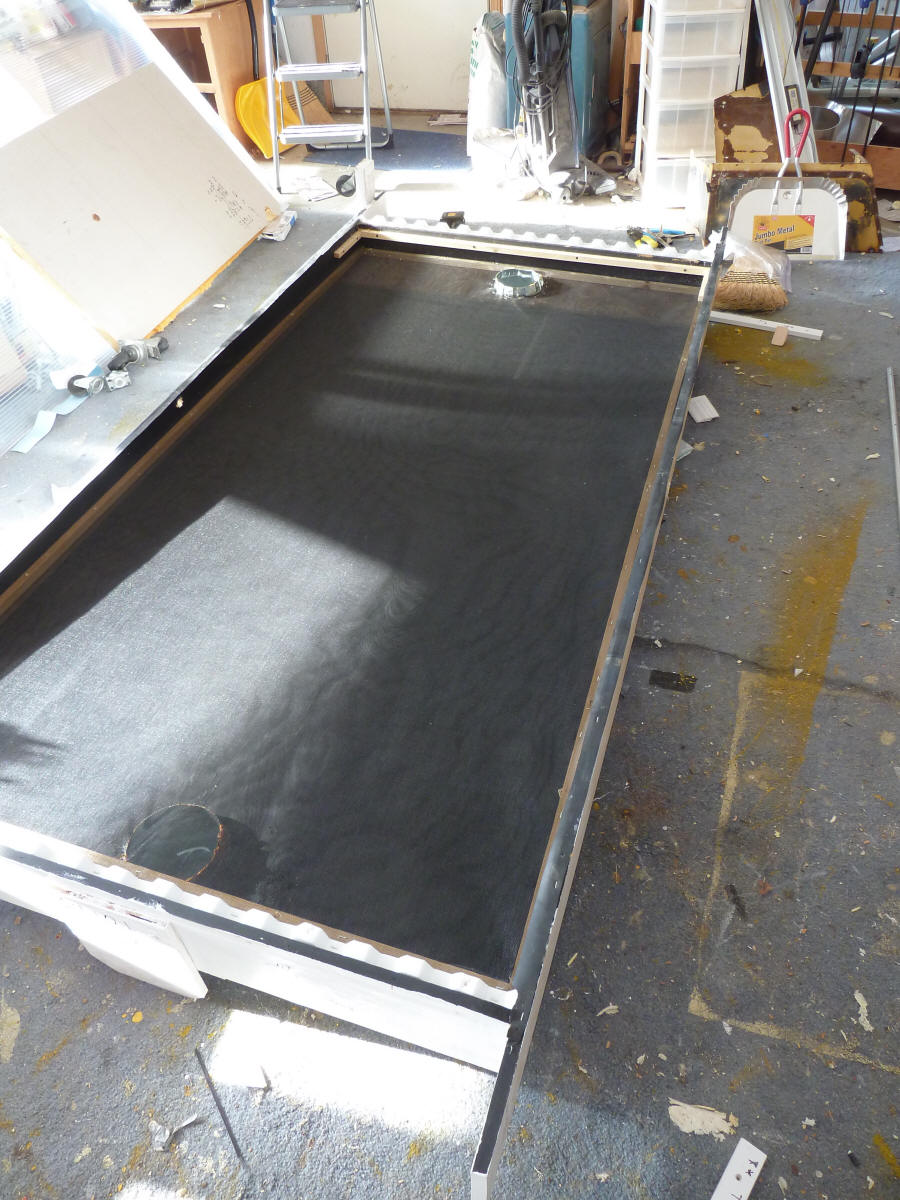
Screen absorber installed. Note tilt from close
to glazing at top to far from glazing at
bottom. Circular 6 inch duct at bottm os the inlet.
Circular 6 inch duct at top (near) under the screen
is the outlet. |
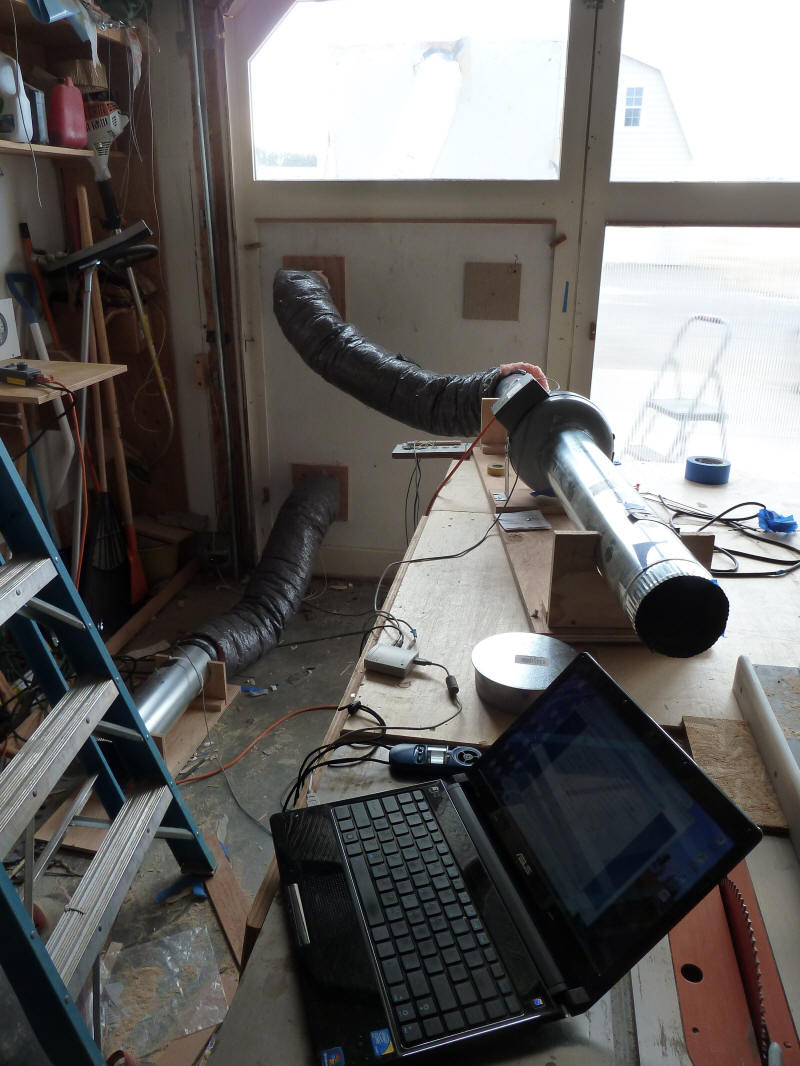
Test Setup
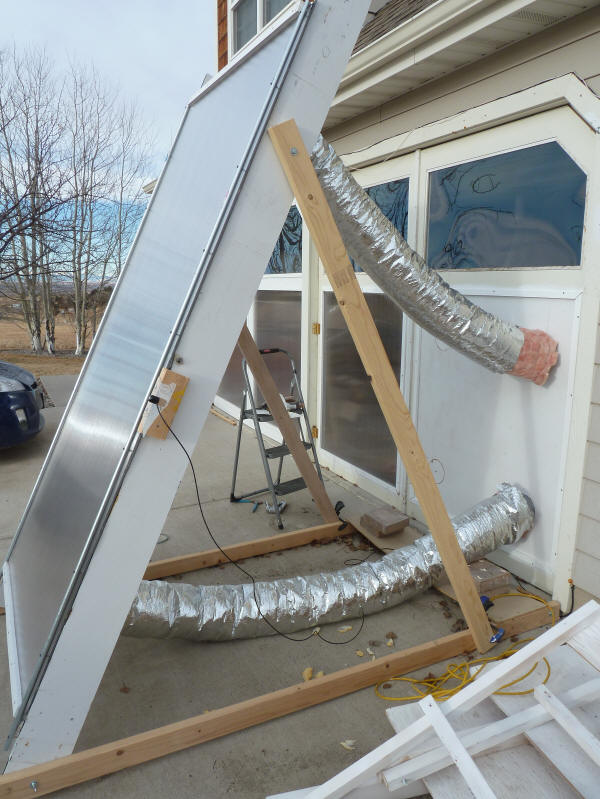
The collector is mounted on a stand just outside the shop main door tilted at
about 70 degrees. The collector azimuth can be adjusted to face the sun
during the day. The inlet and outlet ducts are brought back to the shop
using 6 inch diameter HVAC flex ducts that are insulated.
An Apogee pyranometer is mounted to the collector about half way up and in
the plane of the collector glazing.
Inside the shop, the a blower was setup to suck air from the collector exit
vent into the shop. A speed control was used to adjust the blower
speed and flow rate.

Inlet duct on the lower left of the door, and
outlet duct above in and extending onto the
saw table. |
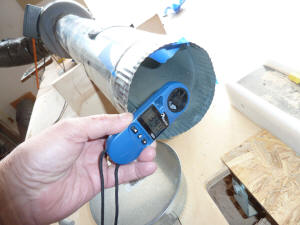
Kestrel anemometer used to measure
duct velocity. |

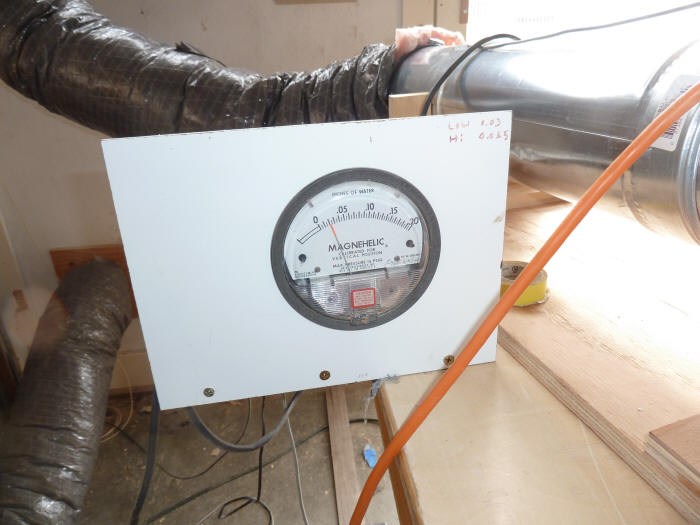
Magnehelic pressure gage used to
measure collector pressure drop. |
Most of the ducting is 6 inch diameter, but is stepped down to 5 inches at
the fan. The fan outlet duct is also 5 inches, and that duct exit is where
the air velocity is measured.
The collector pressure drop is measured between static ports in the rigid 6
inch duct sections, so the collector pressure drop includes the drop due to
about 20 ft of the flex ducting.
The duct inlet and outlet temperatures are made in ducts using thermistors
that are logged on Onset Computer U12 loggers. The thermistors are low
mass, fast acting. They are secured near the centerline of the ducts.
Results
Data was taken for flow rates of 4.3, 3.3, 2.1 and 1.5 cfm per sf of
collector area. Several readings were taken at each flow rate at
intervals of 3 to 5 minutes. The sun was generally good, but there were
some high thin clouds moving in and out -- I tried to pick periods of relatively
constant sun intensity for each flow rate run. Sun levels were high (up to
1200 watt/sm) due to the clear air and reflective snow in front of collector.
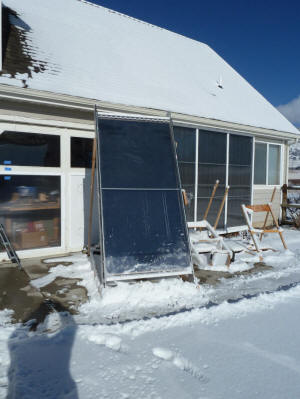
There was a reflective snow field in front
of the collector for the test. |

The sun was generally good, but
occasional high thin clouds did come in. |
The spreadsheet below gives the measured data and the calculated flow rate,
heat out, solar in, and efficiency for all of the runs.
| Initial test of the low flow,
high temperature, dense mesh solar air heating collector. |
|
|
|
|
|
|
|
1/16/2012 |
|
|
|
|
|
|
|
|
|
|
Outlet Area |
0.136 |
sf |
| This is the 4 by 8 ft collector, 3 alum
screen absorber, black back wall, glazed with twin wall |
|
|
avg density |
0.061 |
lb/cf |
| Weather was sunny, cold, fresh snow on
ground in front of collector -- some parts with wn |
|
|
Col Area |
32 |
sf |
|
|
|
|
|
|
|
|
|
|
|
Heat Cap air |
0.24 |
BTU/lb-F |
|
|
|
|
|
|
|
|
|
|
|
|
|
|
| |
F |
F |
F |
F |
ft/min |
watt/sm |
ft/min |
cfm |
cfm/sf |
F |
BTU/hr |
BTU/hr |
|
| Time |
Tambient |
Tin |
Tout |
Tglaz |
Velocity |
Sun |
Vin |
Total flow |
Flow/sf |
Temp Rise |
Solar In |
Heat Out |
"Efic" |
|
12:37 PM |
start test -- logger btn press
-- maximum flow rate |
|
|
|
|
|
|
|
|
|
|
|
|
|
12:37 PM |
16 |
55.9 |
97.1 |
72 |
1003 |
1159 |
894 |
136.4 |
4.3 |
41.2 |
11761 |
4937 |
42.0% |
|
12:41 PM |
16 |
55.8 |
96.7 |
72.7 |
982 |
1158 |
945 |
133.6 |
4.2 |
40.9 |
11750 |
4798 |
40.8% |
|
12:45 PM |
16 |
56.4 |
96.5 |
70.9 |
1040 |
1154 |
922 |
141.4 |
4.4 |
40.1 |
11710 |
4982 |
42.5% |
|
12:47 PM |
Reduce flow rate --logger btn press abouit 3.2
cfm/sf |
|
|
|
|
|
|
|
|
|
|
|
|
|
12:49 PM |
16.5 |
55.7 |
108.5 |
72.1 |
780 |
1152 |
660 |
106.1 |
3.3 |
52.8 |
11690 |
4920 |
42.1% |
|
12:52 PM |
16.5 |
55.2 |
109.5 |
72.7 |
765 |
1151 |
673 |
104.0 |
3.3 |
54.3 |
11679 |
4962 |
42.5% |
|
12:55 PM |
16.5 |
55.8 |
110.1 |
71.5 |
775 |
1160 |
665 |
105.4 |
3.3 |
54.3 |
11771 |
5027 |
42.7% |
|
1:00 PM |
16.5 |
55.7 |
113.2 |
73.3 |
796 |
1196 |
670 |
108.3 |
3.4 |
57.5 |
12136 |
5468 |
45.1% |
|
1:03 PM |
16.5 |
65.4 |
114.2 |
75.2 |
748 |
1204 |
660 |
101.7 |
3.2 |
48.8 |
12217 |
4361 |
35.7% |
|
1:04 PM |
Reduce flow rate-- logger btn press about 2.1
cfm/sf |
|
|
|
|
|
|
|
|
|
|
|
|
|
1:06 PM |
16 |
55.7 |
124.8 |
75.8 |
495 |
1130 |
|
67.3 |
2.1 |
69.1 |
11466 |
4086 |
35.6% |
|
1:09 PM |
16 |
55.5 |
127 |
78.2 |
495 |
1105 |
|
67.3 |
2.1 |
71.5 |
11213 |
4228 |
37.7% |
|
1:11 PM |
16 |
55.5 |
128.3 |
80.6 |
525 |
1186 |
|
71.4 |
2.2 |
72.8 |
12035 |
4566 |
37.9% |
|
1:13 PM |
16.5 |
55.6 |
130 |
80.6 |
526 |
1182 |
|
71.5 |
2.2 |
74.4 |
11994 |
4675 |
39.0% |
|
1:15 PM |
IR pics 668 - 686 |
|
|
|
|
|
|
|
|
|
|
|
|
|
1:19 PM |
16.5 |
55.6 |
130.4 |
|
510 |
1190 |
|
69.4 |
2.2 |
74.8 |
12075 |
4557 |
37.7% |
|
1:20 PM |
Reduce flow rate -- logger btn press about 1.5
crm/sf |
|
|
|
|
|
|
|
|
|
|
|
|
|
1:23 PM |
17 |
56.5 |
134.1 |
85.6 |
350 |
1185 |
|
47.6 |
1.5 |
77.6 |
12024 |
3245 |
27.0% |
|
1:26 PM |
17 |
56.5 |
139.3 |
90.8 |
345 |
1190 |
|
46.9 |
1.5 |
82.8 |
12075 |
3413 |
28.3% |
|
1:28 PM |
17 |
56.6 |
142 |
92 |
345 |
1200 |
|
46.9 |
1.5 |
85.4 |
12177 |
3520 |
28.9% |
|
1:30 PM |
17 |
56.8 |
143.6 |
93.8 |
350 |
1233 |
|
47.6 |
1.5 |
86.8 |
12512 |
3629 |
29.0% |
|
1:34 PM |
IR pics 687 - 693 |
|
|
|
|
|
|
|
|
|
|
|
|
|
2:19 PM |
22 |
55.6 |
112.1 |
71 |
338 |
823 |
|
46.0 |
1.4 |
56.5 |
8351 |
2281 |
27.3% |
|
2:20 PM |
btn push -- IR pics 694-704 |
|
|
|
|
|
|
|
|
|
|
|
|
Columns:
Tambient - ambient temperature measured 50 ft away.
Tin -- collector inlet temperature -- this was air drawn
from the shop.
Tout -- collector outlet temperature
Tglaz -- Glazing outside surface temperature measured
with a surface moutn thermocouple (see notes below on this)
Velocity -- velocity in ft/min measured at the end of the
5 inch fan outlet duct.
Sun -- Solar intensity in the plane of the collector
watts/sm
Total flow -- Total outlet flow in cfm = (Veocity)*(Duct
Area)
Flow/sf -- the flow rate per sqft of collector = (Total
flow/32)
Temp Rise -- Temperature rise for the collector = Tout -
Tin
Solar In -- Solar power into the collector = (Sun
intensity)*(Collector area)
Heat Out -- heat power out of the collector = (Flow
rate)*(Air density)*(Tout - Tin)*(60 min/hr)*(Heat Capacity of Air)
"Efic" -- Approximate efficiency = (Heat Out)/(Solar In)
%
An air density of 0.061 lbs/cf was used -- this is corrected for our 5000 ft
altitude and the average temperature of the collector air. This calculator
was used...
Temperature Rise
One objective was to achieve large temperature rises and high output
temperatures. At the lower flow rates, I'd say the collector does pretty
well with output temps in the 140 F area -- these would have been more like 150
F had it not been for the relatively cool shop air that was used for collector
input.
But, as the next section shows, the high output temps come as some expense in
heat output and efficiency.
Heat Output and Efficiency Variation with Flow Rate
The plots show the collector heat output vs the collector temperature rise
achieved, and the collector "Efficiency" vs the collector flow rate.
For the collector as is is now, there is a significant drop in efficiency and
heat output to get the higher collector output temperatures. The heat
output drops from about 5000 BTU/hr down to about 3500 BTU/hr -- a hit of about
30%. Maybe we can do better? How?
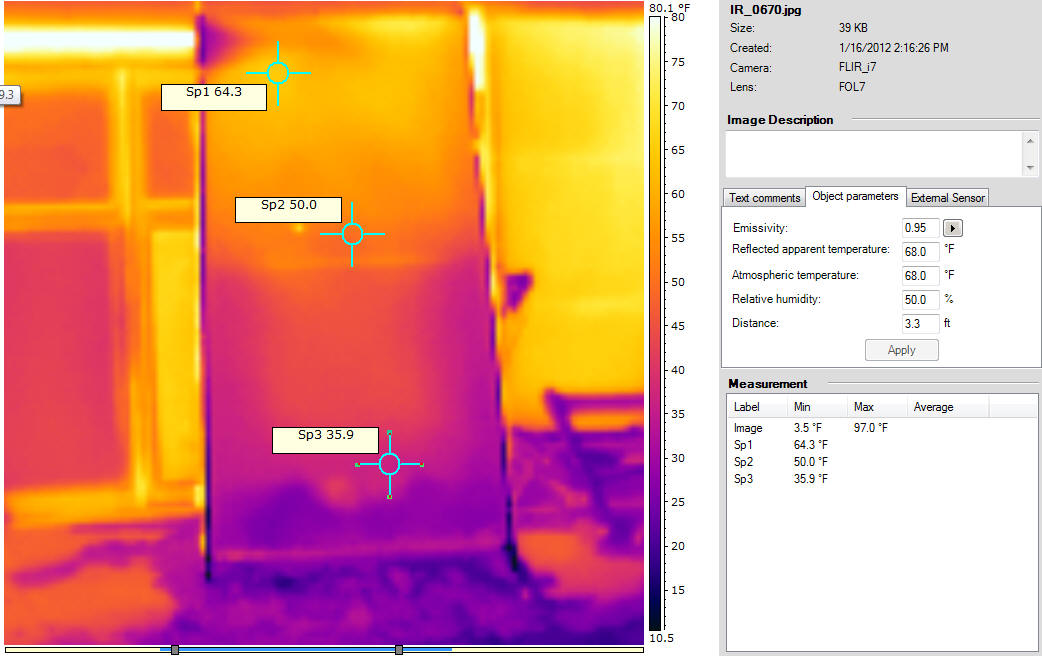
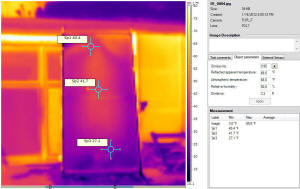
Glazing Temperatures
The IR pictures below show temperatures on the outer surface of the glazing
for the tested airflows.
Cooler glazing temperatures would indicate that collector heated air is not
working its way out to the glazing and warming it, and/or that the glazing was
seeing less radiation heating from the absorber screens.
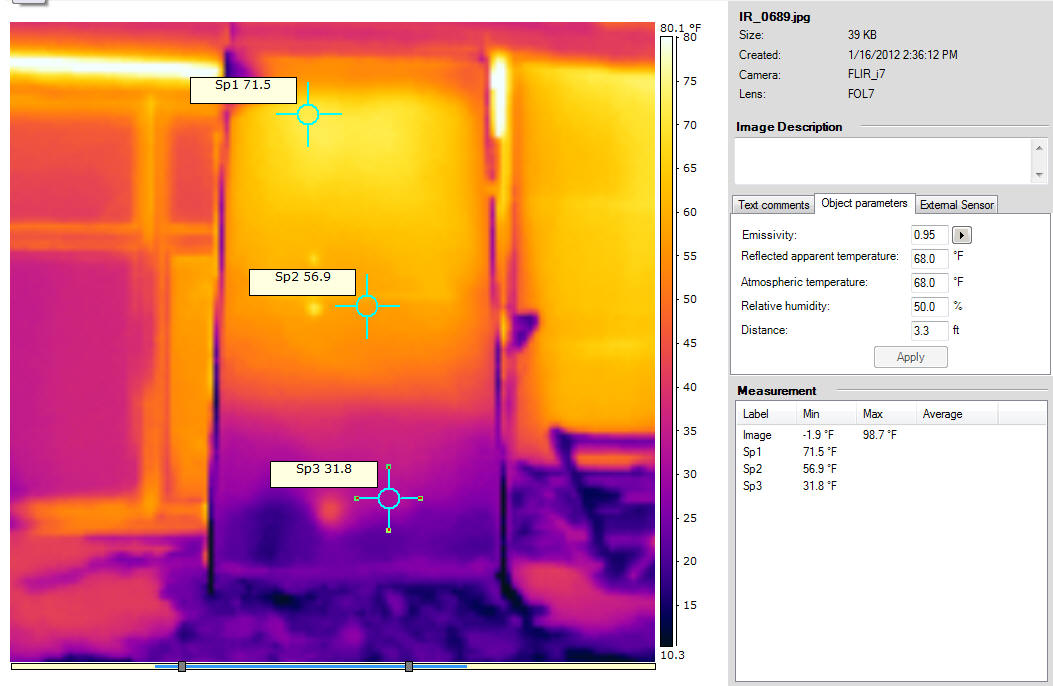
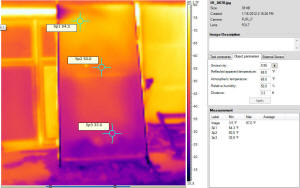
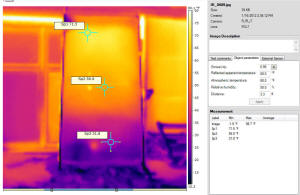
The three side by side IR pics below are with 3.3, 2.1 and 1.5 cfm/sf of
collector flow rates.
All done to a temperature scale of 10F to 80F.
No IR picture was taken for the 4.2 cfm/sf flow rate.
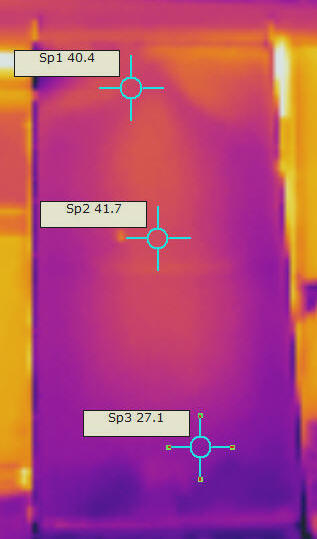
Flow Rate 3.3 cfm/sf |
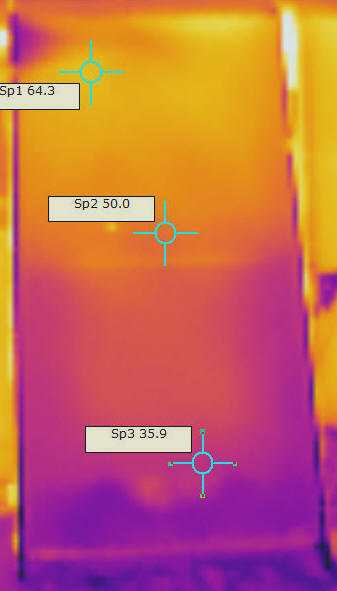
Flow Rate 2.1 cfm/sf |
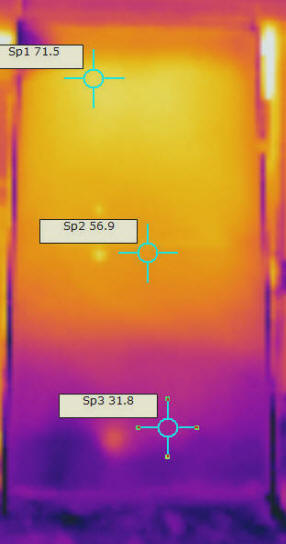
Flow Rate 1.5 cfm/sf |
Its clear that the glazing is getting hotter for each reduction in flow rate
-- hotter glazing means more heat loss and lower efficiency.
Potential causes of the hotter glazing with lower airflows:
- Increased radiation from the screen to the glazing
because the lower airflow does not cool the screen as well?
- Air that has been heated by going through the screens
penetrating back into the area in front of the first screen?
- Non-uniform flow across the full screen area causes the
screens in the low airflow areas (toward the top?) to heat up more and radiate/convect
heat to the glazing?
- Or?
At any rate the picture of room air (55 F in this case) evenly flowing into
the whole surface of the absorber from front to back and cooling the first
screen layer and acting as a radiation shield does not appear to be happening in
this collector.
Other things to note.
- It looks like there may be some leakage of cold ambient
air into the collector under the glazing. The blue streak coming in at the
upper left is actually colder (20F) than the shop air -- so it seems pretty
likely this is a leak. Same may be true at a couple places along the
bottom.
- In the pictures below, the area to the right of the new
collector is my wall mounted solar water heating collector. It is also
glazed with twinwall polycarbonate. The storage tank temperature for that
system reached 139.5F by afternoon.
- See the section below on Glazing Temperature Puzzle for
more on a small uncertainty in the glazing temperature pictures.
These are the same three pictures as above in the full size versions -- click on
pictures for full size.
Flow Rate 3.3 cfm/sf
Flow Rate 2.1 cfm/sf
Flow Rate 1.5 cfm/sf
Collector Pressure Drop
I did not measure the pressure drop on this test, but on a test a couple days
before:
At a flow rate of 2.1 cfm/sf the pressure drop was 0.09
inches of water (22 pascal)
At a flow rate of 1.4 cfm/sf the pressure drop was 0.025
inches of water (6 pascal)
So, pressure drops are very low -- especially considering that these pressure
drops include about 20 ft of the 6 inch flex duct, making the drop across the
screen itself even lower.
Logger Record
This shows the logger report for the temperatures and solar intensity.
Note that the ambient temperature sensor was poorly located and is reading
too high. I used the manually read temperatures from a thermometer mounted
on the north wall of the barn about 50 ft away instead. Note that at one
point around 2:10 pm the solar readings exceed the pyranometers maximum of 1250
watts/sm and are truncated for a few minutes.
Where to Go From Here?
The Glazing Temperature Puzzle
I was looking for a way to validate the temperatures of the glazing that the
IR camera shows. Part of the reason for this is that I am having trouble
finding a good value to use for the emissivity of the twinwall polycarbonate to
plug into the camera. So, I 1) attached a surface mount thermocouple to
the outside of the twinwall to measure the "actual" surface temperature, and 2)
applied a roughly 1.5 by 1.5 inch piece of blue painters tape a few inches below
the thermocouple -- this is the often used technique of placing a patch of
something with know emissivity over an unknown emissivity surface, and then
measure the temperature on the known patch.
So, for the painters tape, one might expect that the tape would reach the
same temperature as the glazing, and if the glazing and tape had the same
emissivity, they would show the same color on the IR pictures. Or, if one
believed that the tape emissivity was about 0.95, one could read the tape
temperature with the camera set at 0.95, then change the emissivity setting
until the surrounding twinwall showed the same temperature.
Well, on the picture taken with the camera emissivity set to 0.95, the
twinwall temp shows 54.4F and the painters tape 72.4F. There is no way to
adjust the emissivity enough to get the twinwall up to 72.4 F or anywhere close.
I am inclined to believe that the tape is actually running hotter because it is
heating up from absorbed sunlight. It looks like its actually
running nearly 20F hotter than the glazing. Does this seem reasonable?
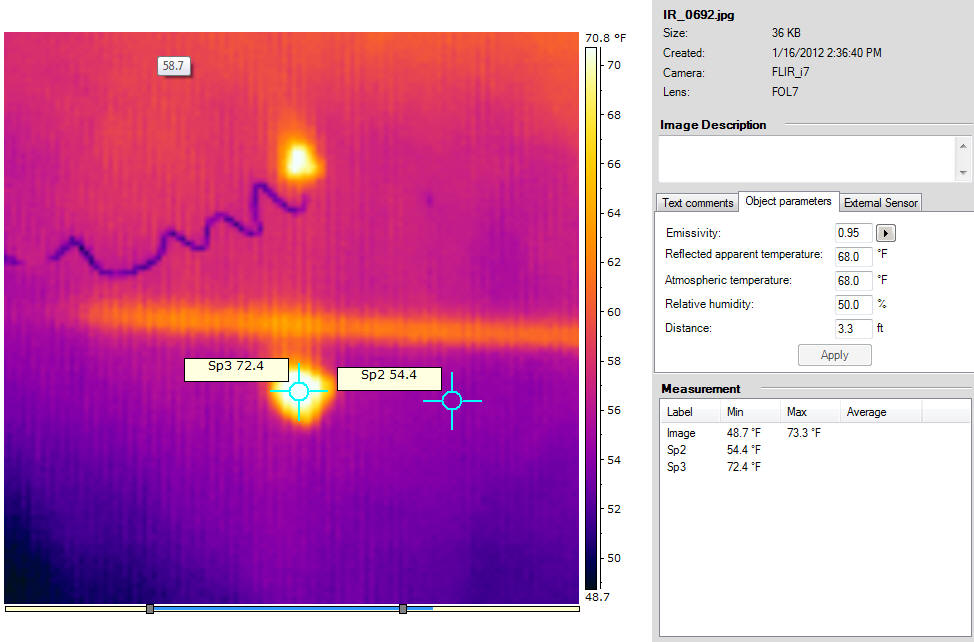
IR picture showing painters tape (bright spot at 72.4F) on the twinwall
glazing with emissivity set to 0.95.
(he bar across the picture just above the tape is the glazing support just
inside the glazing).
Looking at the surface mounted thermocouple, there are three values that can
be compared (see picture below):
- the thermocouple reading 81F (from
the logger plot)
- the IR camera temperature reading on the thermocouple
80F
- the IR camera temperature reading on the twinwall near
the thermocouple 54.4F
So, the IR camera and the actual thermocouple reading agree well, but the
twinwall glazing surface temperature is reported to be about 25 F lower.
Again, there is no way to adjust the emissivity setting to get the twinwall
temperature up more than about 1F. So, I am inclined to believe that all
three temperatures above are correct (or close) and that the twinwall is really
quite a bit cooler than the thermocouple because the thermocouple is opaque and
absorbing more solar radiation than the twinwall. Any thoughts on this?
I'll probably try this again when the sun is not shining on the collector and
see if the readings get closer together.
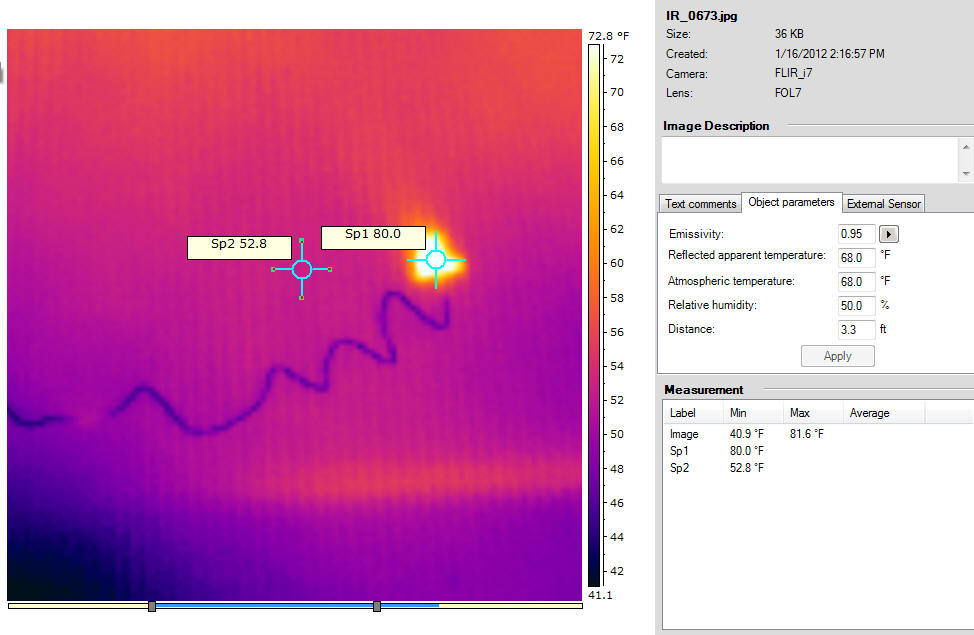
IR picture of thermocouple (the bright spot with the wire leading to it), and
the surrounding twinwall.
Gary
January 18, 2012