
Search
The Renewable Energy site for Do-It-Yourselfers
Side by Side Collector tests with identical collectors - but unequal heat output
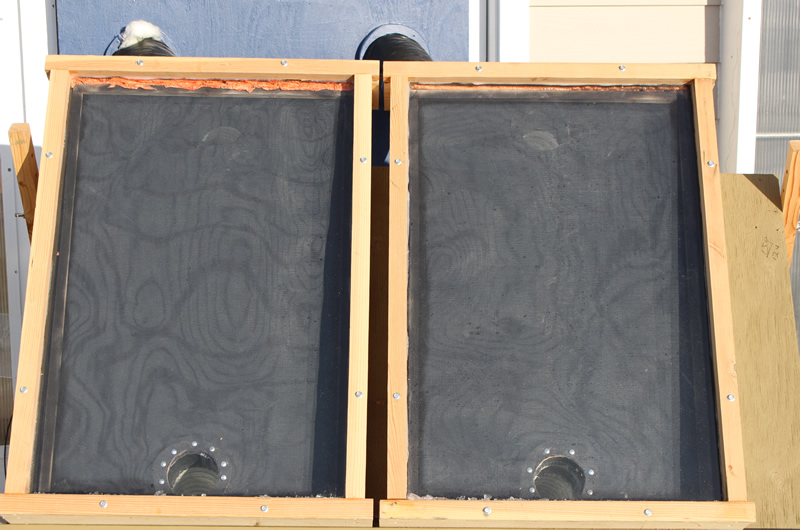
Tested two identical air heating collectors side by side.
Both collectors use the 2 layers of screen absorber (alum screen, about 3/4 inch apart)
Collectors 2 ft wide by 3 ft high -- made just for testing purposes.
Collectors mounted on the same rack side by side
Each collector served by near identical, short, 4 inch ducts.
Small identical fans used to drive each collector with inlets at the same place.
Calibrated thermometers that were checked against each other during test -- only 0.2F different.
Airflow velocity meausred with new Kestrel wind turbine anemometer -- velocity test location located near the end of an about 3 ft long straight section. Flow straighener used at upstream end of the 3 ft section. Also checked the velocities with an Alnor Velometer.
Airflow through both collectors adjusted to be the same.
Took a dozen or so measurements over about 4 hours with good (but no perfect) sun, and two airflow levels (raw data is listed below).
Results:
One collector consistently shows an about 5% advantage in heat output over the other.
After an earlier test that showed the same thing, I took the glazing off both collectors to look for differences -- found a few small things, but made no difference in the outcome.
A really interesting thing is that when I switched the two collectors, so now what was the right is in the left position, and vice-versa, the higher heat output stayed on the left position.
So, it looks like difference is not in the collector itself, but something in the left setup that results in 5% higher heat output measurments.
So, maybe the ground in front of the left collector is more reflective, but it does not really look that way in the pictures?
Or, there is something about the left duct system, fan, or velocity measuring point that gives the left side an advantage? But, the two duct systems are very close to the same, the fans are same brand and model, the velocity measurement setup is the same for both.
It is notouriously hard to measure duct velocity well, but a 5% difference in velocity would be about 15 fpm -- its hard fathom that I could be consistently off by that much?
So, I'm really puzzled -- any ideas on what might be happening?
Some other odds and ends:
- Also measured velocity with an Alnor Velometer and got values that are about 5% higher than the Ketrel, but completely consistent with the Kestrel readings.
- Started day with collectors pointing near south, then as day went on turned collector toward south west. This changes the ground in front of the collectors, but did not appear to change the difference between right and left very much.
Just as a side issue, I did go ahead an check a 4 screen version of the collector to see if the added layers of screen made much difference. There was still about a 5% difference between the right and left positions, so I'd tentatively conclude that more screens (at least on this design) does not gain much if anyting. The screens on the 4 screen were spaced about 1/4 inch apart, and on the 2 screen about 3/8 inch apart. Collector back is black.
I'd really like to do some more testing of air collector design differences, but I'd like to get the two identical collector tests to come out closer to the same output before doing this.
Pictures and Raw Data Below
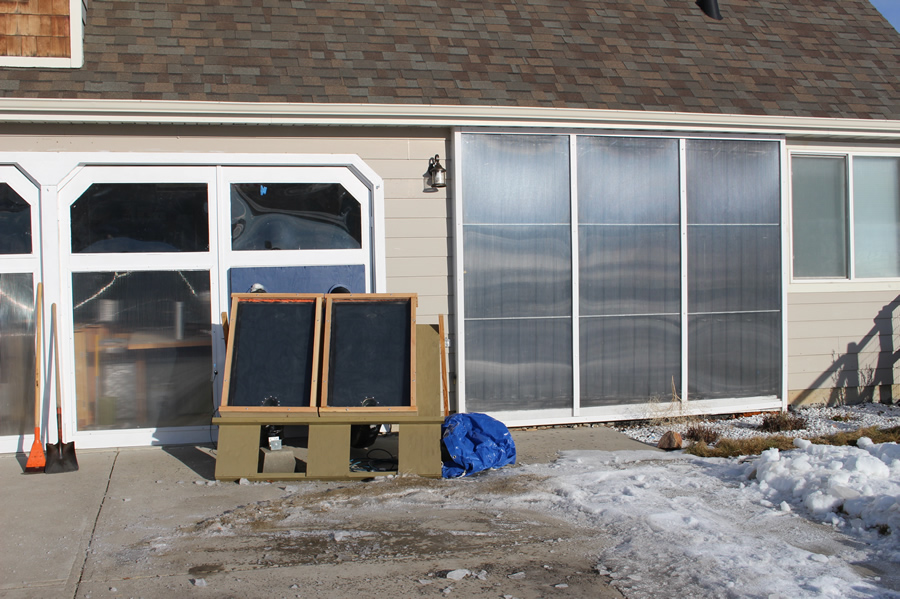
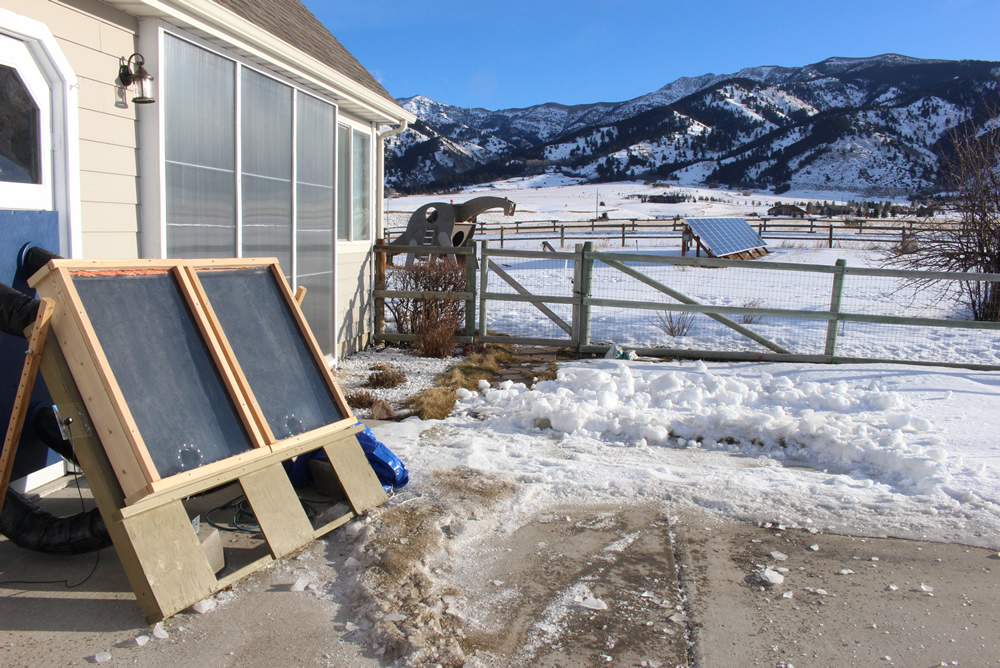
Differences in ground reflectivity might favor one collector?
I could not scrape off all the ice on driveway in front of collectors at start of day, so sanded the ice to make it not so reflective. Later in day I was able to remove the ice.
The right hand collector in picture is the one that does better (looking from the front) -- the east one.
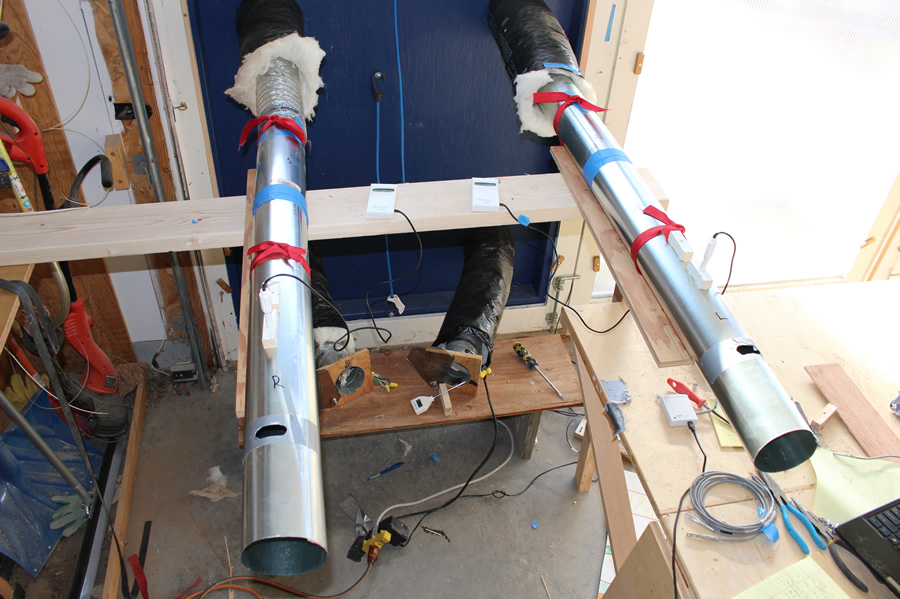
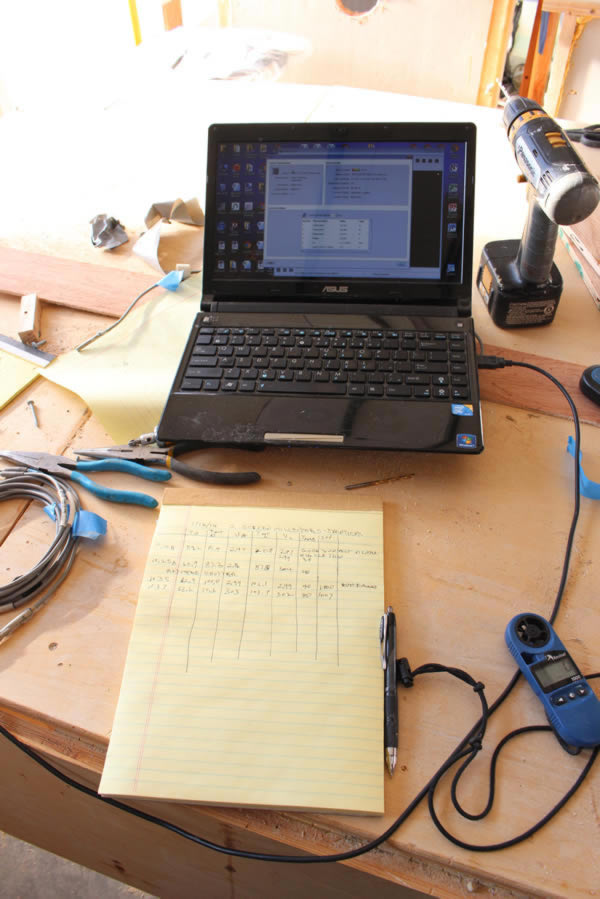
The outlet ducts from the collector inside the shop. The thermometer probes used to measure outlet temp can be seen inserted into the top of the ducts.
The oval hole in the top of the duct near the outlet is where the Kestrel velocity readings were taken.
The two inlet fans are visible at the bottom -- the plastic shutters on the front are used to adjust airflow. These are duct booster fans from Home Depot.
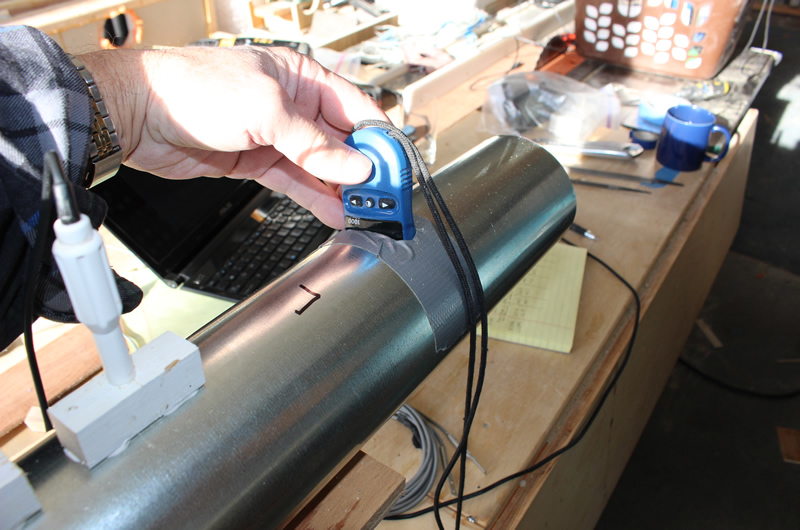
Taking a velocity reading with the Kestrel.
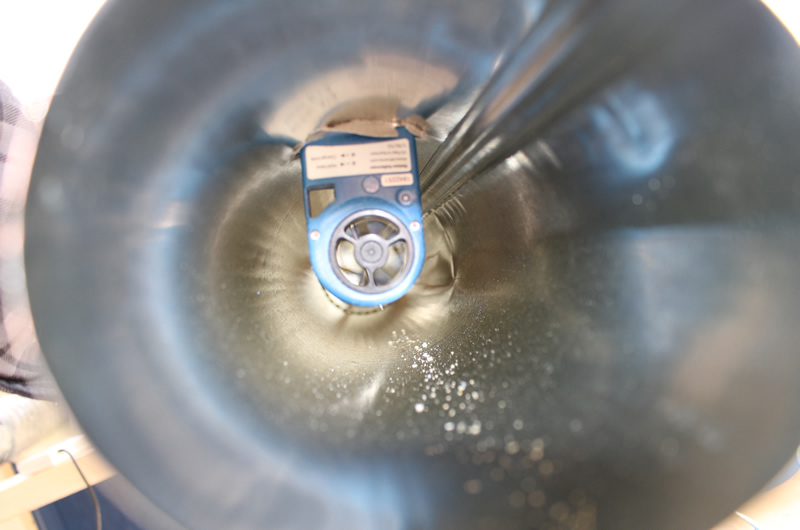
Looking down duct at Kestrel -- postioned in middle of flow at same place in both ducts.
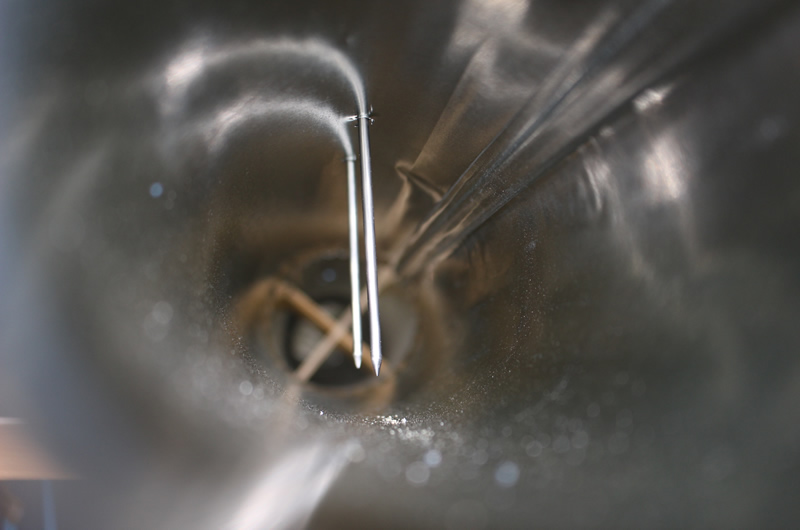
Duct view of the temperature probe in duct. There are two in the same duct in this case to see how close they were -- they diffred by only 0.2F.
The flow straightener is visible down at the start of the duct.
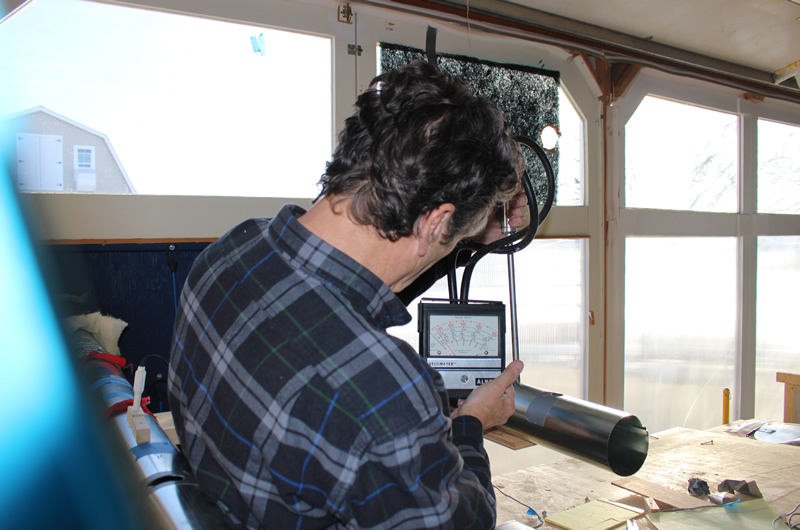
The Alnor Velometer pitot tube velocity measurment device being used as a check ont he Kestrel. With the ducts set up to show the same velocity on the Kestrel, the Velometer also showed equal duct velocities, but about 5% higher. These Velometers are very nice, very high quality analong instruments that come up on ebay for as little as $30 (prices vary a lot). Labs are getting rid of them to replace them with digital instruments.
sun readings come off the pyranometer logger and were recorded along with temperature and velocity. Plot of pyranometer log readings below.
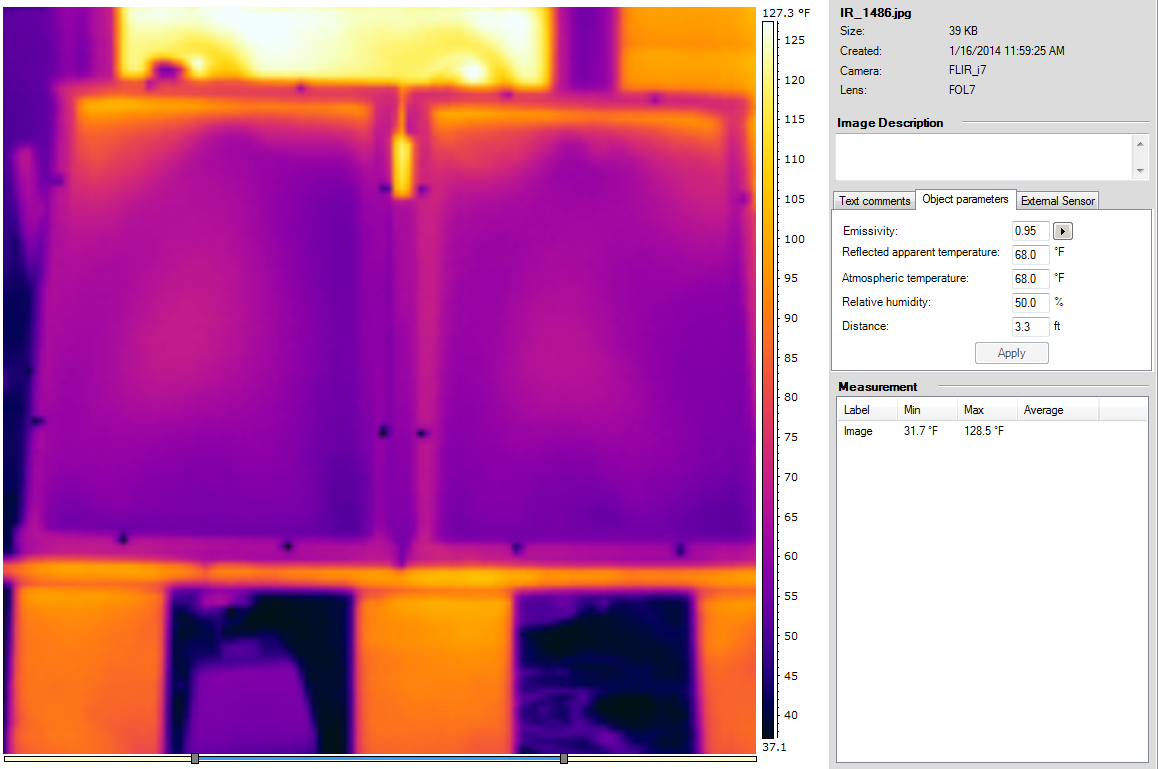
The two collectors side by side thermal image. pretty close. If you do an area temperature measure over the left collector and compare it to an area temp measure over the right, they are only about 0.2F different.
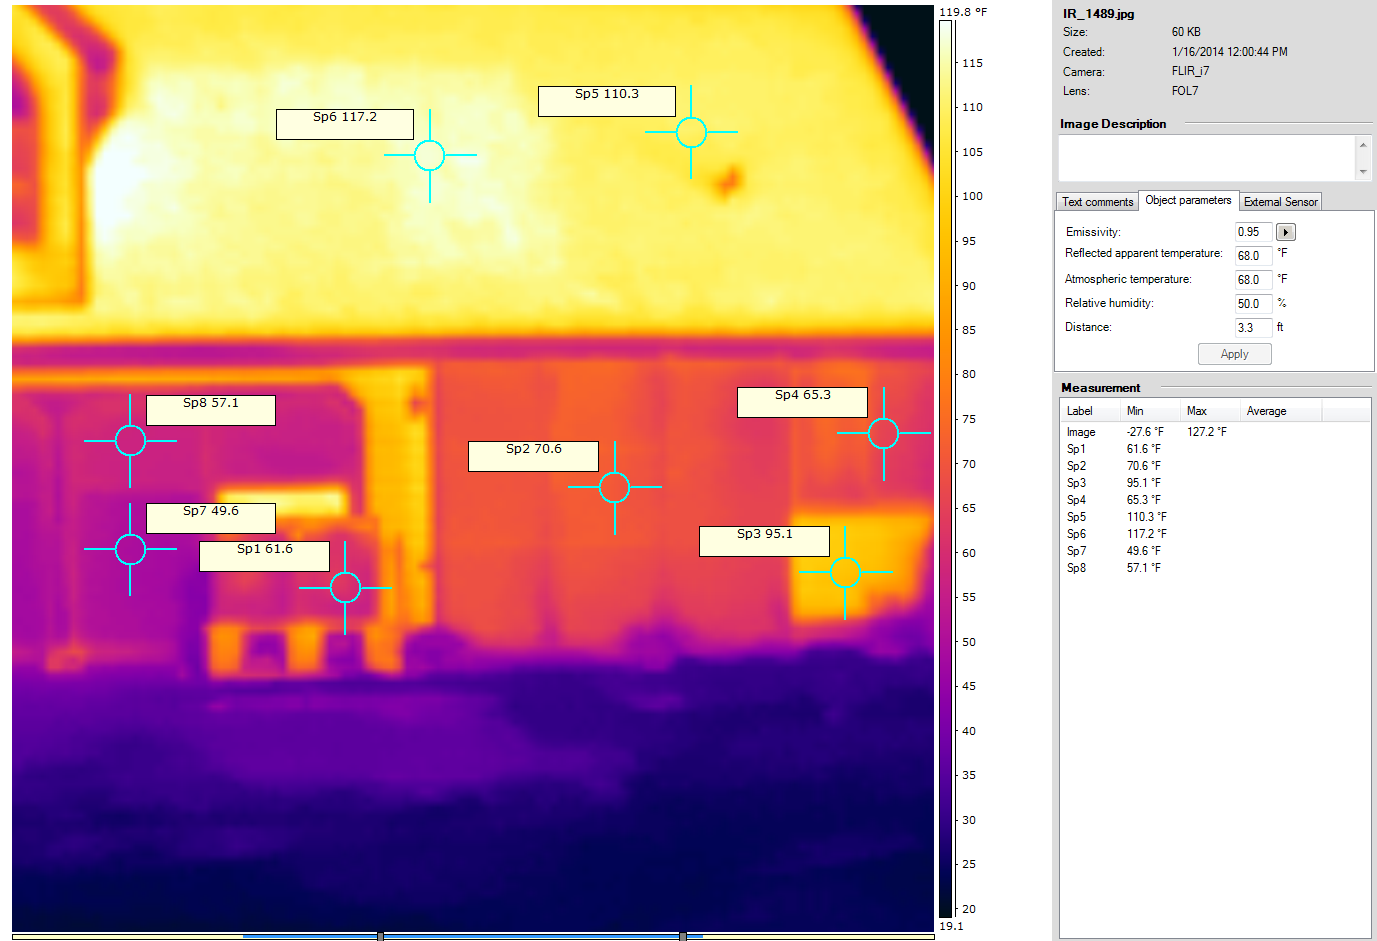
This is just an interesting study in glazing temperatures on various collectors -- nothing to do with the side by side test.
Going from right to left:
The 65.3 F is on a double glazed house window with a thermal curtain behind it.
The 95.1 F is on the house siding (grey)
The 70.6 is on our twinwall glazed solar water and space heating collector -- hot sure what the tank temp at the time was, but probably about 120F.
The 61.6 F is on the small test screen collector
The 49.6 F is on the twinwall glazed part of the solar doors on my shop.
The 57.1 F is on the single glazed part of the solar doors on my shop.
The ss7.2 F and 110.3 F are on the roof shingles (dark).
My shop solar doors make for a comparison of twinwall and single glazing, since the top half is single glazed and bottom half twinwall.
If the ambient temp is about 40F, then the twinwall temp dif is (49.6 F - 40F) = 9.6 F, and single glazed is (57.1F - 40F) = 17.1F, so heat loss through single glazed part is about 17.1/9.6 = 1.78 times greater.
If you assume the sun was 300 BTU/hr-sf, then the extra loss in incoming solar on the twinwall would be about 10% or 30 BTU/hr.
Will have to think about how to turn the 17.1F difference in glazing temp into a heat loss number to compare to the 30 BTU/hr that the double glazing transmission loss costs you.
This is the data for Jan 16, 2014:
|
T col in |
Tcol out right |
V right |
Tcol out left |
V left |
Tambient |
Sun |
Heat out right |
Heat out left |
|
|
|
|
|
|
| 10:10 AM |
59.2 |
81.4 |
297 |
81.8 |
297 |
34 |
|
538.15 |
547.84 |
1.018 |
|
Removed some more ice from driveway and |
| 10:25 AM |
60.9 |
87.3 |
286 |
87.8 |
304 |
36 |
|
616.26 |
667.45 |
1.083 |
|
|
|
|
|
|
| 10:35 AM |
62.9 |
100 |
299 |
102.1 |
299 |
36 |
1000 |
905.39 |
956.64 |
1.057 |
|
turned stand to face more west and directly toward sun |
| 10:37 AM |
63.2 |
101.6 |
303 |
103.7 |
302 |
36 |
1007 |
949.66 |
998.28 |
1.051 |
|
|
|
|
|
|
| 10:40 AM |
Checked thermometers by moving both to right col. Right thermometer reads 0.2F lower than left. |
|
|
|
|
|
|
| 10:44 AM |
64.7 |
104.9 |
302 |
107.2 |
304 |
36 |
1030 |
990.89 |
1054.52 |
1.064 |
|
|
|
|
|
|
| 10:47 AM |
IR pics 1484 to 1491 |
|
|
|
|
|
|
|
|
|
|
|
|
|
|
| 10:50 AM |
65 |
101.6 |
301 |
103.4 |
304 |
36 |
894 |
899.17 |
952.79 |
1.060 |
|
(sun was 1050 at 10:51am) |
|
|
|
Decrease flow rate |
|
|
|
|
|
|
|
|
|
|
|
|
|
|
| 11:02 AM |
63.3 |
110.7 |
226 |
114.3 |
223 |
36 |
956 |
874.34 |
928.26 |
1.062 |
|
|
|
|
|
|
| 11:04 AM |
65.7 |
109.9 |
226 |
113.4 |
223 |
36 |
933 |
815.31 |
868.19 |
1.065 |
|
|
|
|
|
|
|
Switched left and right collectors |
|
|
|
|
|
|
|
|
|
|
|
|
| 11:15 AM |
67.4 |
104.7 |
225 |
108.1 |
224 |
40 |
997 |
684.99 |
744.11 |
1.086 |
|
|
|
|
|
|
| 11:18 AM |
66.5 |
108.5 |
227 |
112.1 |
227 |
40 |
1050 |
778.16 |
844.86 |
1.086 |
|
|
|
|
|
|
| 11:25 AM |
65.3 |
107.7 |
302 |
110.6 |
304 |
40 |
1054 |
1045.12 |
1123.99 |
1.075 |
|
|
|
|
|
|
|
IR pics 1492 to 1499 |
|
|
|
|
|
|
|
|
|
|
|
|
|
|
| 11:30 AM |
67 |
107 |
303 |
110 |
305 |
40 |
1048 |
989.22 |
1070.44 |
1.082 |
|
|
|
|
|
|
|
|
|
|
|
|
|
|
|
0.00 |
|
|
|
|
|
|
|
| 1:08 PM |
64.2 |
99.3 |
301 |
100.9 |
305 |
45 |
750 |
862.32 |
913.60 |
1.059 |
|
|
|
|
|
|
| 1:22 PM |
65.3 |
105 |
294 |
106.7 |
294 |
45 |
822 |
952.64 |
993.44 |
1.043 |
|
|
|
|
|
|
| IR pics 1500 - 1506 |
|
|
|
|
|
|
|
0.00 |
|
|
|
|
|
|
|
| 1:30 PM |
65.3 |
103.8 |
294 |
104.9 |
294 |
45 |
925 |
923.85 |
950.24 |
1.029 |
|
|
|
|
|
|
| 2:05 PM |
65.4 |
108.7 |
293 |
110.9 |
292 |
45 |
940 |
1035.49 |
1084.39 |
1.047 |
|
|
|
|
|
|
| 2:10 PM |
65.1 |
108.2 |
293 |
110.5 |
292 |
45 |
895 |
1030.71 |
1082.01 |
1.050 |
|
|
|
|
|
|
| 2:15 PM |
64.9 |
106.2 |
293 |
108.7 |
293 |
45 |
858 |
987.67 |
1047.45 |
1.061 |
|
|
|
|
|
|
|
|
|
|
|
|
|
|
|
|
|
|
|
|
|
|
|
| Took velocity readings with Alnor Velometer to compare to Kestrel |
|
|
|
|
|
|
|
|
|
|
|
V velo right |
Vkes right |
V velo left |
V kes left |
|
|
|
|
|
|
|
|
|
|
|
|
| 2:45 PM |
322 |
295 |
322 |
298 |
|
So, velometer readings are bout 8% higher than kestrel, but consistent with kestrel. |
|
|
The right most numeric column shows the ratio of the heat output of the left collector to the right collector. It shows anywhere from 3 to 9% higher output on the left collector with a lot of points between 4 and 6%.
Sun Levels during Test
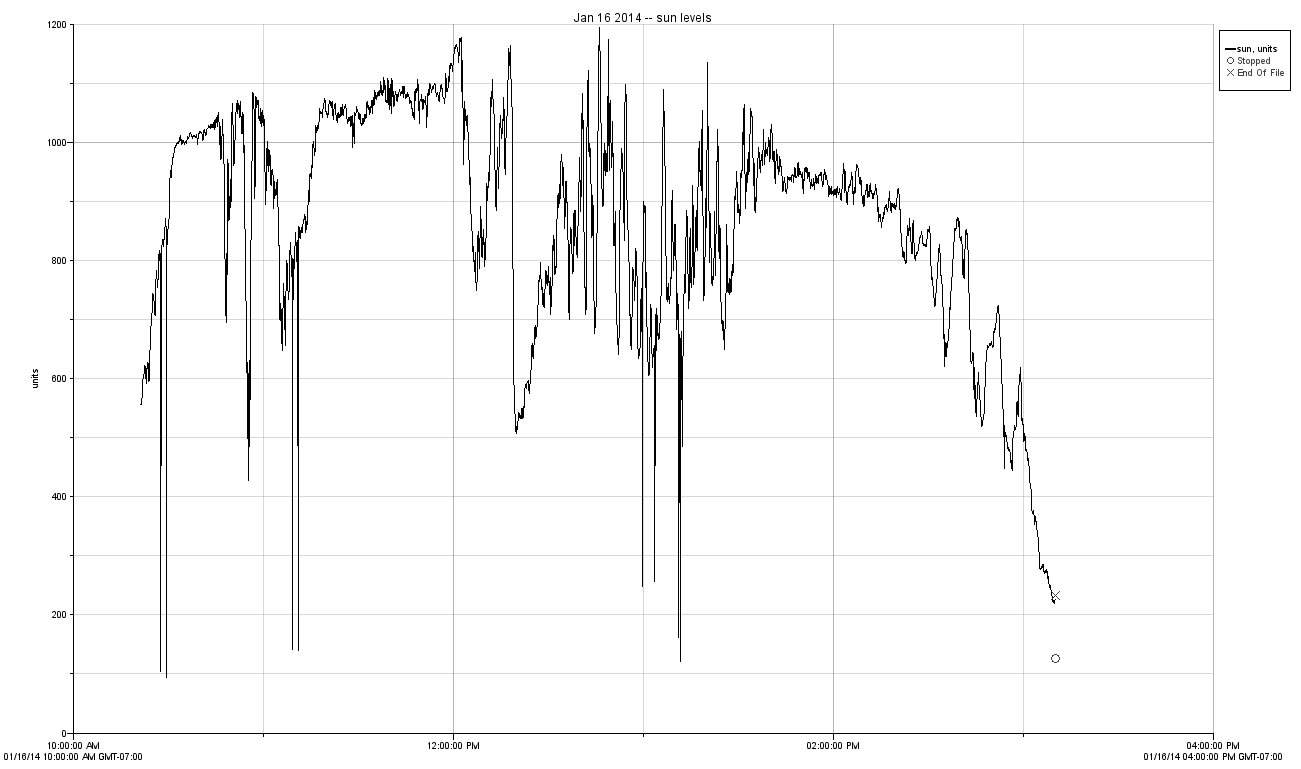
The sun was good, but there were high thin clounds that made the sun level vary some from minute to minute. And, occasionally some thicker clouds.