Search
The Renewable Energy site for Do-It-Yourselfers
Title ..
Confirugation
Heating Performance
Thermal Camera Pictures
Temperature Environment
Stagnation
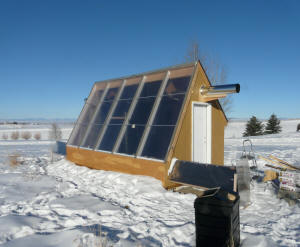
Configuration -- January 4, 2013 Test
In this test, the sunspace has been optimized for space heating the attached
house via the in the following ways:
- Large area of high tilt angle south facing glazing
- Double glazing in the form of twinwall polycarbonate
- Very low thermal mass in the sunspace (so heat goes to the house instead
of heating up sunspace mass)
- Non-glazed surfaces are well insulated and well sealed to reduce heat
loss to the outside
- The floor is insulated and low in mass
- All surfaces that see the sun are painted dark to absorb sunlight, and
are low mass so they heat quickly and transfer that heat to the air.
- Two fans to remove heated air from the sunspace peak -- these fans are
pretty well matched to the maximum rate at which the sunspace can produce heat with one
fan near the east end one near the west end.
This is a mean, lean, heat making machine!
In this test, black weed fabric is suspended vertically down from the
The idea is to see if having this vertical absorbing fabric will get the hot
air up to the ceiling more efficiently. The day two test drops this fabric
midway through the test, to compare h
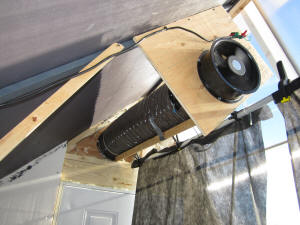
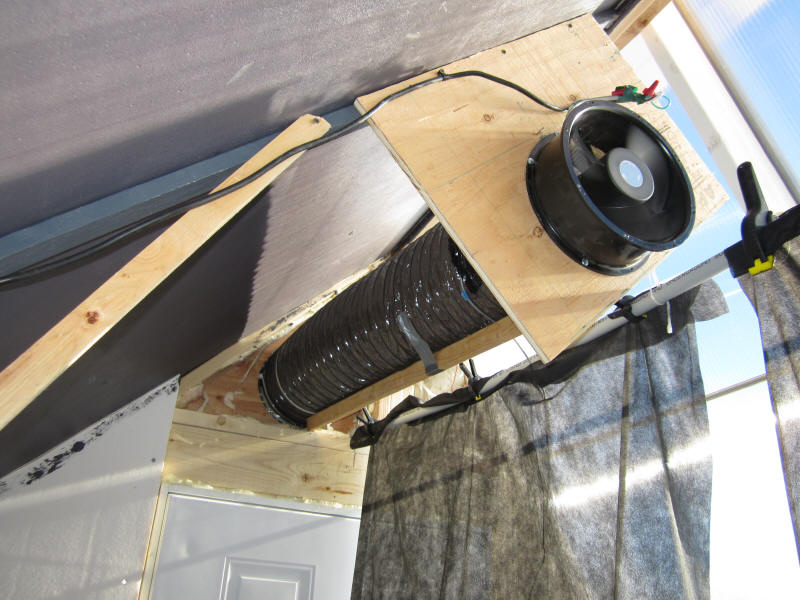
One of the two 10 inch Grainger fans
that push air out of the sunspace.
The duct is extended outside to provide
a long straight duct for more accurate
flow measurements.
The vertical weed fabric screen used
in one of the configurations is also visible.
|
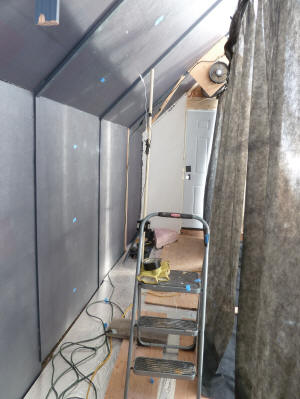
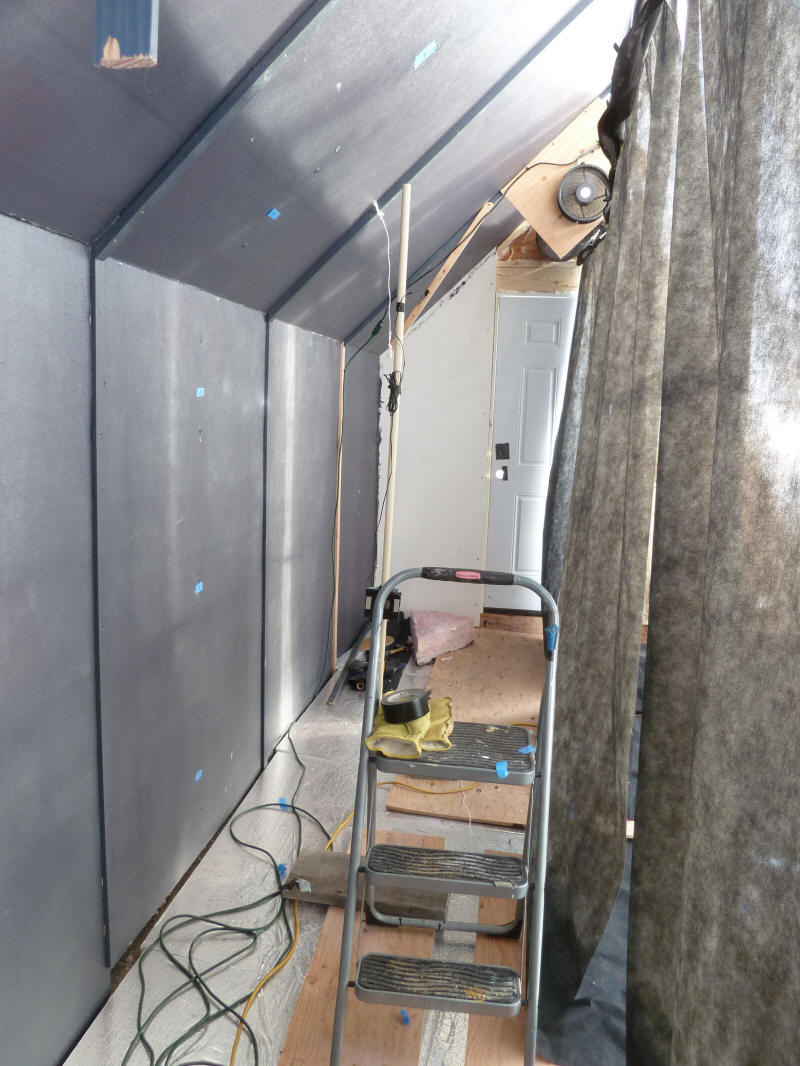
Setup for this test.
North wall is to left, weed fabric hung from
ridge line to right. The vertical pipe has
temperature sensors at 3 ft and 6 ft off floor
between fabric and north wall.
The blue tape spots mark places where surface
temps were taken. |
Same configuration with vertical weed fabric
and picture taken on south side of the fabric.
The vertical PVC pipe has two temperature sensors.
The blue tape spots mark places where surface
temps were taken. |
eat production with and without it.

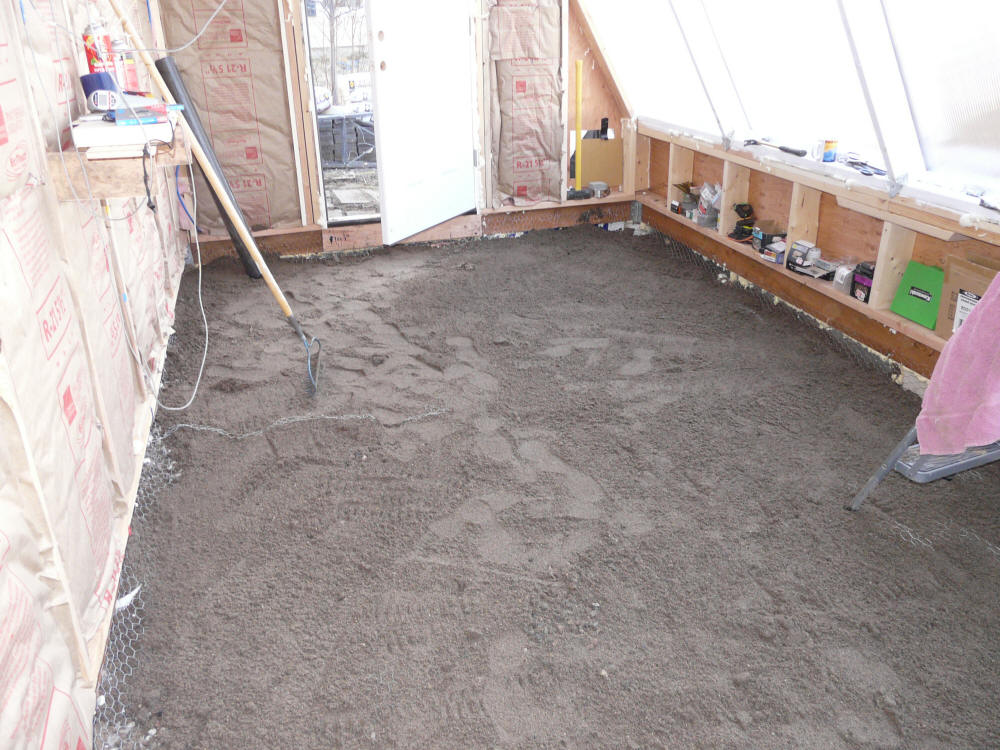
Floor is some sand over dirt followed by
a layer of 1.5 inch thick Styrofoam
rigid insulation board. |

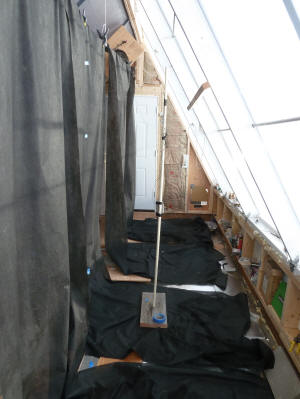
Looking without the vertical weed fabric
in place. The weed fabric hangs
from the plastic pipe running below the ridge.
The floor is dirt covered with 1.5 inch
Styrofoam insulation with some plywood
walking strips laid on it, and black weed
fabric on top.
The two PVC pipe posts support temperature
sensors. |
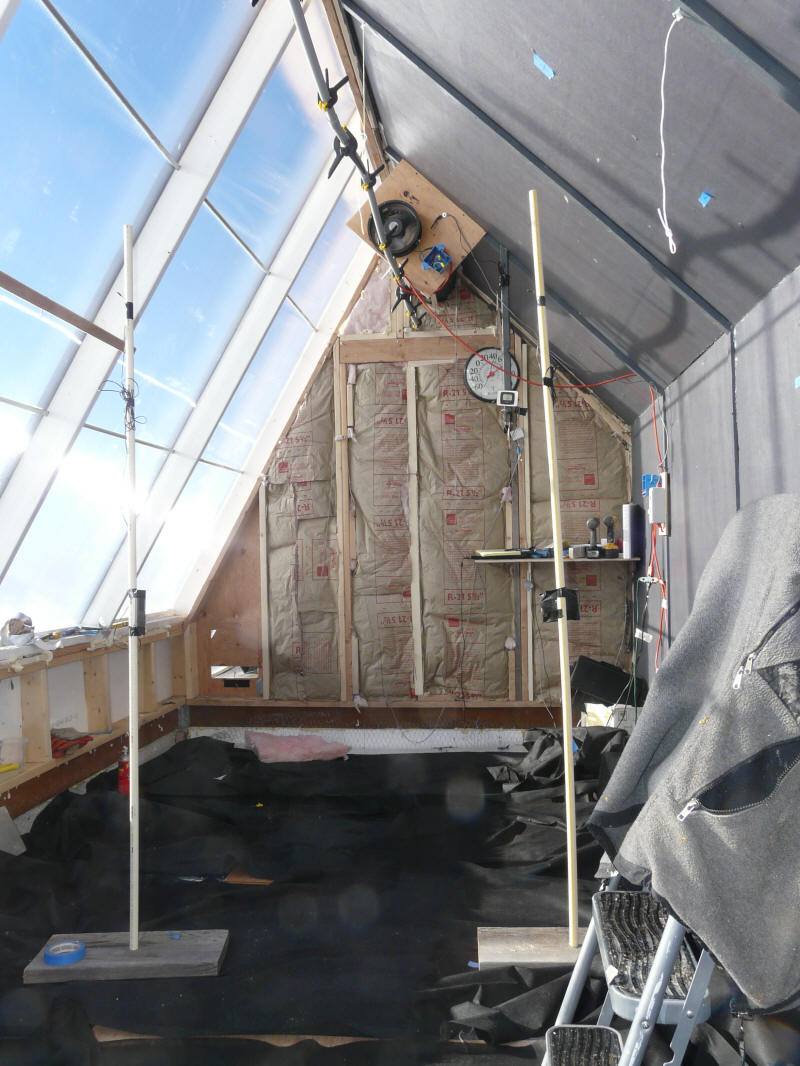
Sunspace on one of the test days.
The two "tunnels" extending east and west from
the lower south corner preheat the flow
of inlet air a bit. |
Inlets and Outlets
The inlets for the sunspace are located on the east and west walls down low
and just behind the south glazing. In an attempt to prewarm the air coming
into the inlet vents, a solar preheat tunnel was added to each inlet (see
picture) . while the inlets were cut as 1 ft square holes in the
wall, they have been reduced to about 3 inches tall by 12 inches wide to prevent
excessive flow and velocity through the inlets -- especially during windy times.
The outlets are located in the east and west ends near the peak. Each
outlet has its own Grainger 10 inch fan and is located about 4.5 ft from the
east (or west) wall. A straight flex duct runs from the fan outlet to the
wall and outside the wall, the duct is extended another 6 ft by a straight 10
inch diameter metal duct. The long straight duct run from the fan is
intended to give steady and straight flow at the outlet where velocity is
measured.
Performance
This was a gang busters clear day -- not a hint of a cloud all day. Its also only a couple weeks after the Winter Solstice, so the days are short
and the sun is low in the sky (about 23 degrees at noon). The outside air
temperature was in the 20'sF. Wind was generally light.
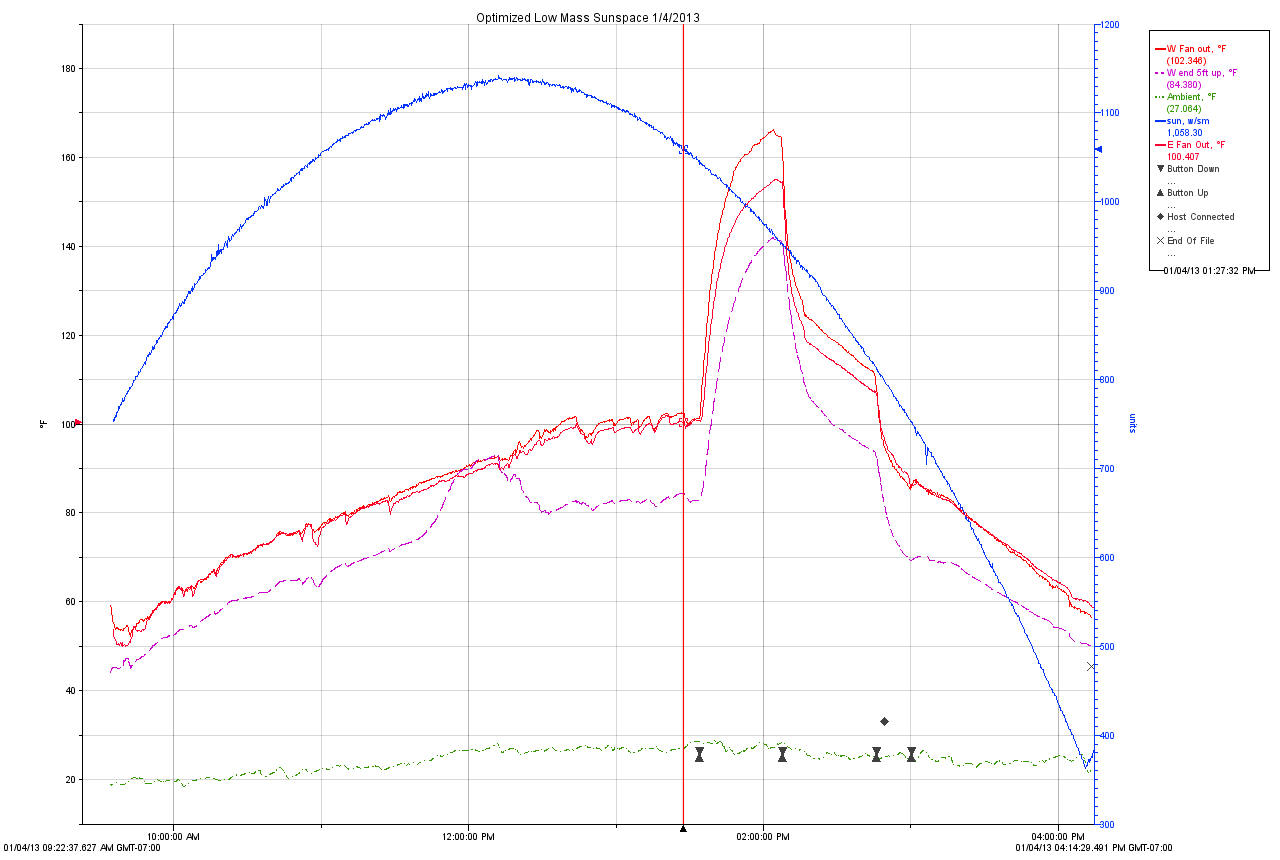
Blue solid line -- sun intensity (w/sm)
Red Lines -- Fan outlet temperatures for East and West fans (F) -- this
is the temperature of the heated air going to the house for space heating.
Green dash-dot -- Ambient temperature (F)
Purple dash line - Temperature at about the 5 ft level in the sunspace (F)
The sunspace was run with the fans on to produced heat for the house from
about 9:30am to about 1:30 pm. At this point the fans were turned off to
let the sunspace stagnate. At about 2:15 pm the fans were turned back on
again.
Total flow rate for the outlet ducts was 670 cfm (based on 614 fpm at outlet
ducts).
Heat Production
Looking at the long period when the fan outlet temperature is around 100F and
ambient temperature is about 26F, the sunspace is producing 670 cfm with a 74 F
temperature rise.
Heat Output = (100F-26F)*(670 ft^3/min)*(0.061 lb/ft^3)*(60
min/hr)*(0.24 BTU/lb-F) = 43,550 BTU/hr (210 BTU/sqft of
glazing)
This is about what a typical 60K BTU gas furnace would
produce.
The heat output for the day looks like this:
|
Time |
Tout (F) |
Tin |
Trise |
Velocity (fpm) |
Duct Area (sf) |
Flow Rate (cfm) |
Air Density (lb/cf) |
Heat Out (BTU/hr) |
|
10:00 AM hour |
61 |
19.8 |
41.2 |
600 |
1.09 |
654 |
0.061 |
23668 |
|
11:00 AM |
76.4 |
22.3 |
54.1 |
600 |
1.09 |
654 |
0.061 |
31079 |
|
12:00 PM |
90 |
26.6 |
63.4 |
600 |
1.09 |
654 |
0.061 |
36422 |
|
1:00 PM |
99.5 |
27.4 |
72.1 |
600 |
1.09 |
654 |
0.061 |
41420 |
|
2:00 PM |
99.5 |
28.3 |
71.2 |
600 |
1.09 |
654 |
0.061 |
40903 |
|
3:00 PM |
87 |
24.8 |
62.2 |
600 |
1.09 |
654 |
0.061 |
35732 |
|
4:00 PM |
64 |
25.1 |
38.9 |
600 |
1.09 |
654 |
0.061 |
22347 |
| |
|
|
|
|
|
|
|
|
| Total |
|
|
|
|
|
|
|
231570 |
So, about 232K BTU heat output for the day -- about equivalent to 3.6 gallons
of propane burned in a 70% efficient furnace.
So, even this modest size sunspace can produce a lot of useful heat on a
sunny winter day -- even for the shortest days of the year.
Stagnation
The fans were turned off at about 1:30 pm just to see what the temperature
would to to with the sunspace stagnated. The inlet vents were blocked with
some (somewhat leaky) fiberglass insulation and the outlets were left open
-- so, there was likely some thermosyphon flow through the sunspace.
The temperature in the outlet duct gets up 166 F just before the fans were
turned back on at 2:15 pm -- it probably would have climbed a few more degrees.
A temperature sensor closer to the peak got up to ???.
So, not surprisingly, this thing gets pretty warm pretty fast with no
airflow. While these temperatures are not dangerously high, some
form of venting would be a good idea when the space heating fans are not
running.
The odd looking double slope to the cool down curve after the fans were
turned back on is because I initially forgot to pull out the fiberglass plugs I
put in the inlet vents. They came out around 2:45 pm, and the cool down
slope steepens reflecting more air circulation.
Efficiency
One difficulty with making efficiency estimates from the performance curve
above is that the even though this is a very low mass sunspace, it apparently
has enough thermal mass that its outlet temperatures and heat output lag a bit
behind changes in sun intensity. You can see this in the time period from
about 12:30 pm to about 1:30 pm -- in this time period, the output temperature
and heat output are nearly constant at just over 100F, but the sun intensity is
dropping from about 1130 w/sm down 1040 w/sm. I believe that if the
sunspace had even lower thermal mass, it would react more quickly to solar
changes.
This effect also shows up if you calculate efficiencies for the morning vs
afternoon. In the morning, the sunspace outlet temperature is lagging
behind the sun level increases and producing lower outlet temperatures than it
would if the sun just stayed steady at one level. In the afternoon the
sunspace outlet temperature drops more slowly than the drop in sun level because
the sunspace mass is losing heat and keeping the temperatures up. So, in
the morning the apparent efficiencies are around 45% while in the afternoon they
are more like 71% -- these are not really valid efficiency numbers in that
conditions are not steady, but they illustrate the lag effect.
To get the best idea of efficiency that I could, I looked
So, how does this compare with a good commercial collector under the same
conditions?
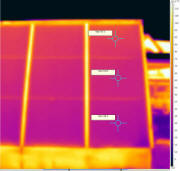
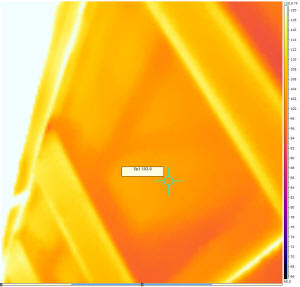
Thermal Pictures
Glazing Temperatures
These pictures need to be clicked on to see the temperature labels.
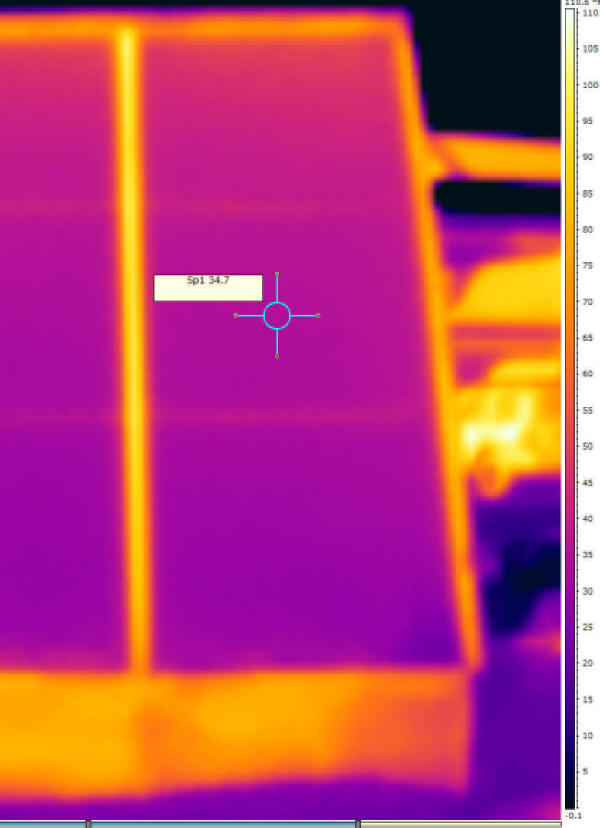
Outside of glazing.
Emissivity 0.95.
|
Inside of glazing -- top.
Top part of glazing panel. |
Inside of glazing - bottom.
Lower part of glazing panel. |
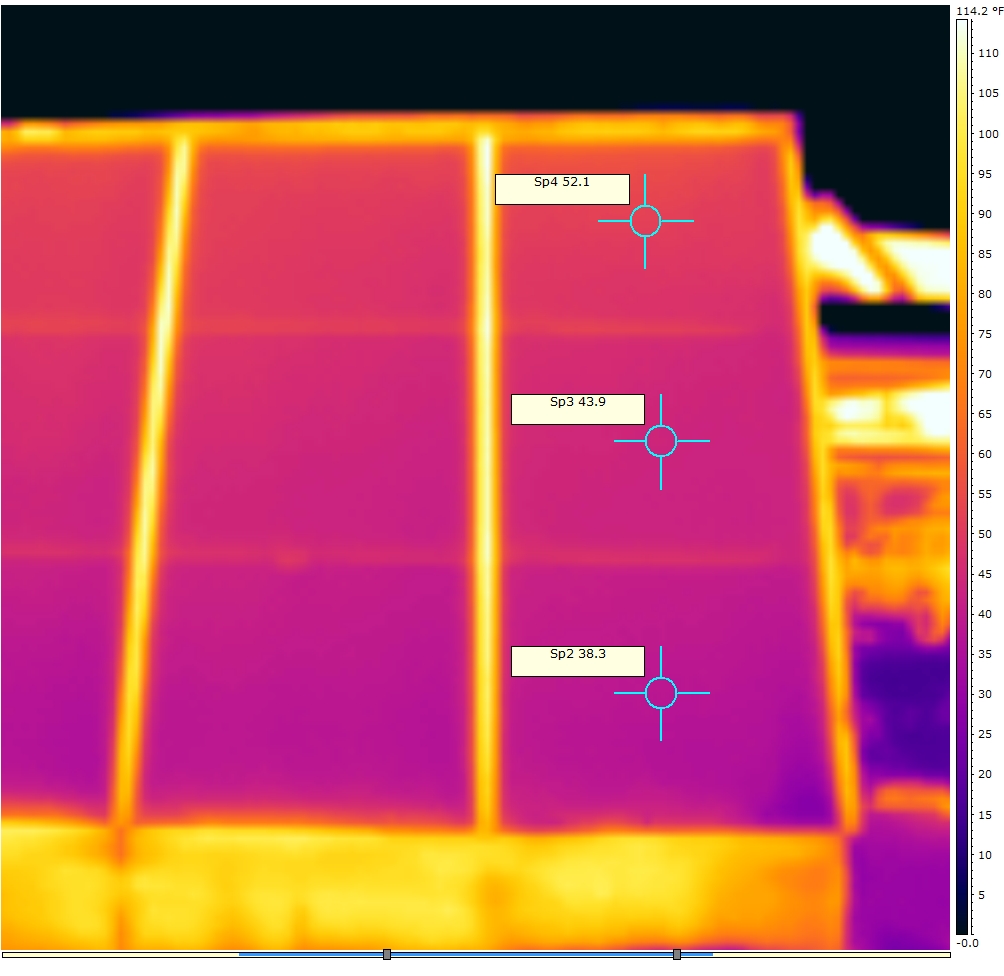
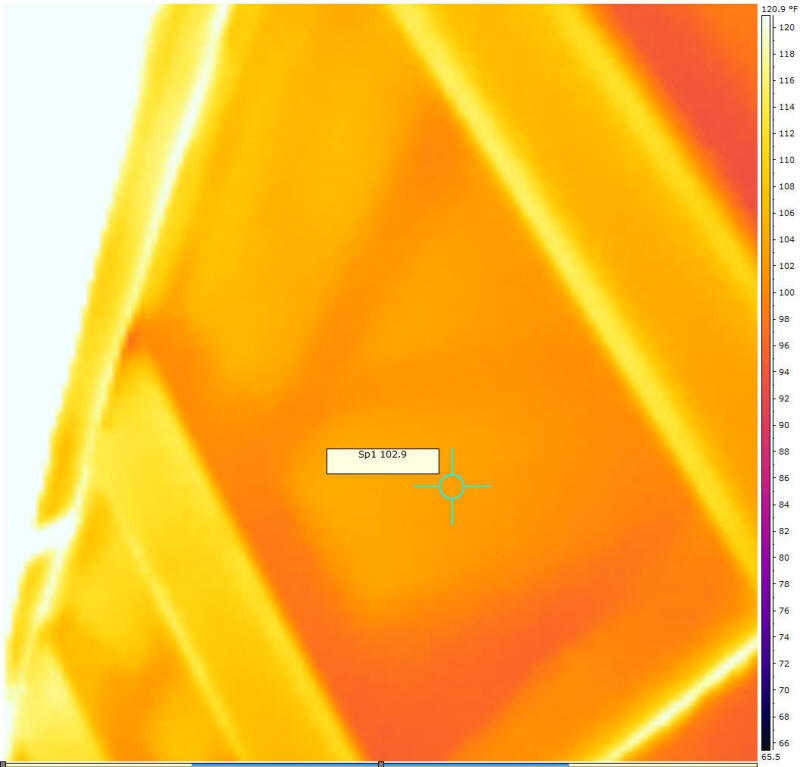
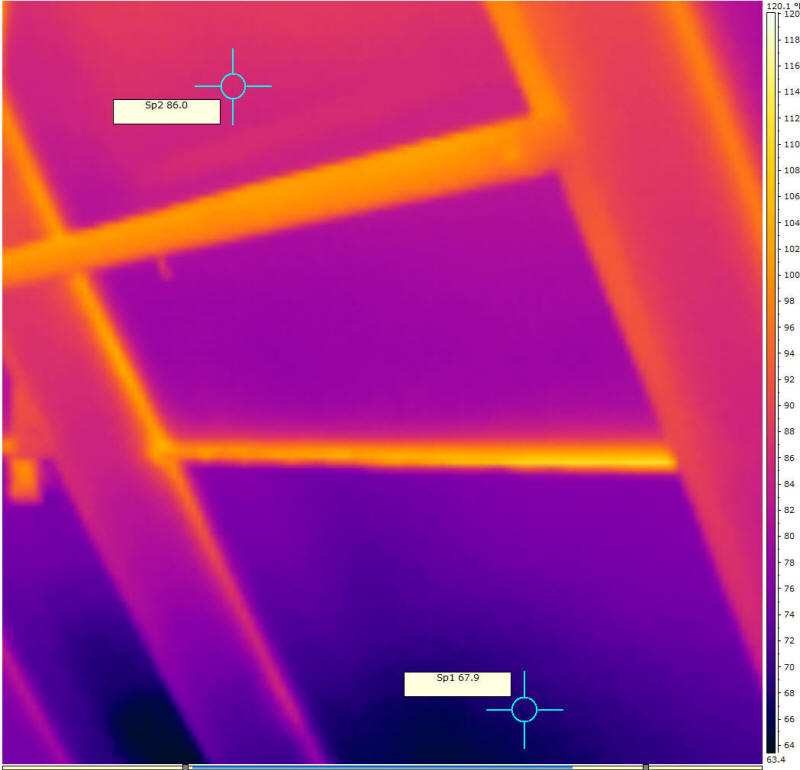
Glazing pictures at 1:46 pm.
The left picture above is of the outside of the glazing with temperatures
ranging from 38F at the bottom to 52F at the top.
The center picture is of the inside of the glazing near the top (the space is
confined enough that I can't get the whole panel in). The temperature is
103F on the inside surface, so the temperature difference across the twinwall
glazing is about 103F - 52F = 51F.
The right picture is of the inside of the glazing near the bottom with a
temperature of 68F. Temperature difference inside outside is 68F - 38F =
30F.
At this time, the conditions are:
Ambient temperature 28F
Fan outlet temperature 99F
Air temperature inside near glazing at bar 1/3 of way up
86F
Sun 1125 w/sm
Solar input 73K BTU/hr
Heat output = 41.5K BTU/hr
Losses = 73K - 41.5K = 31.5K BTU/hr
If you use a glazing average temperature difference of 40F, and R2 for the
glazing, then the rough heat loss through the glazing is (200 sf)(40F)/(R2) =
4000 BTU/hr, which is not remotely close to the 31K BTU/hr total losses -- I
would have expected closer agreement?
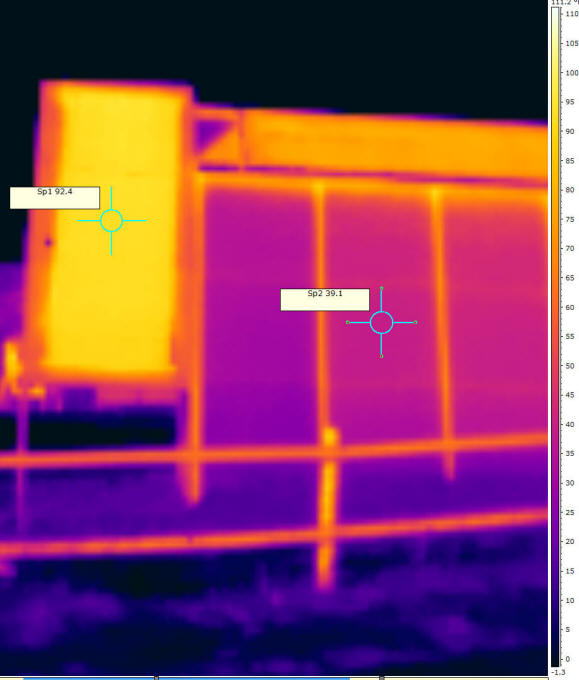
Just as an Interesting Item
I took some IR pictures of two other nearby collectors that face the same way
and are at the same tilt --
The left picture is the sunspace glazing at 3 pm with an outside temperature
of 35 F in the center.
The picture to the right has two collectors.
The right is the solar shed water heating collector with
twinwall glazing. Its outside temperature is similar to the sunspace
collector (4F warmer).
The collector to the right is an unglazed pool heating
collector being used as the prototype for the Off The Shelf DIY water heating
system. Its outside temperature is 92F.
All three collectors were operating at the time.
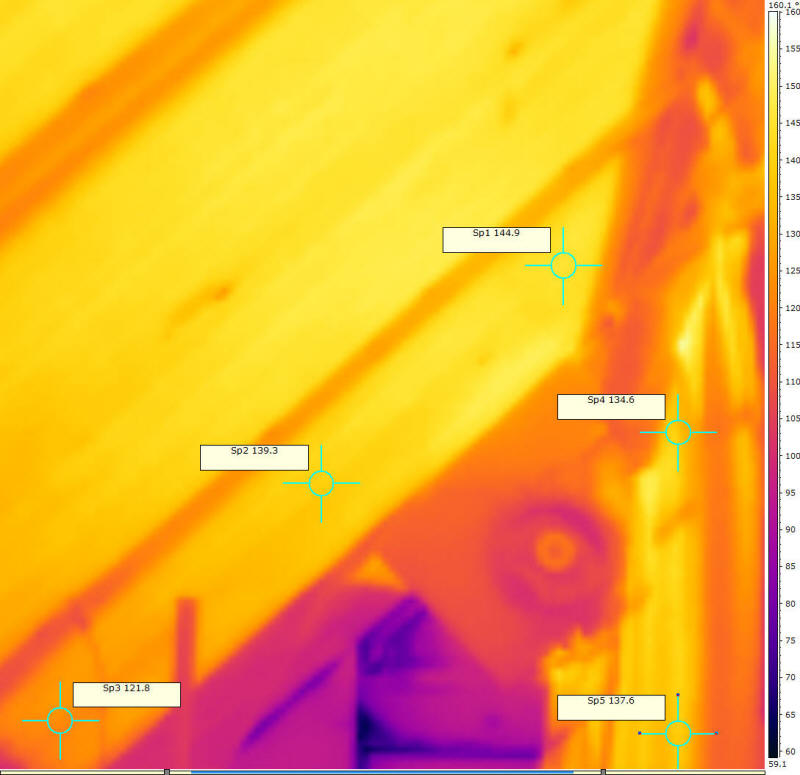
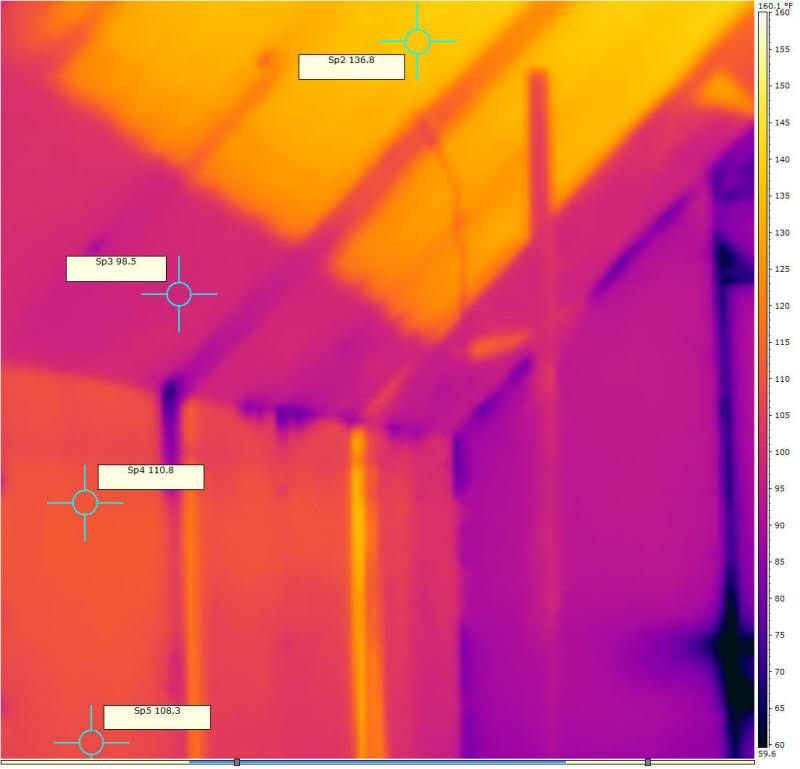
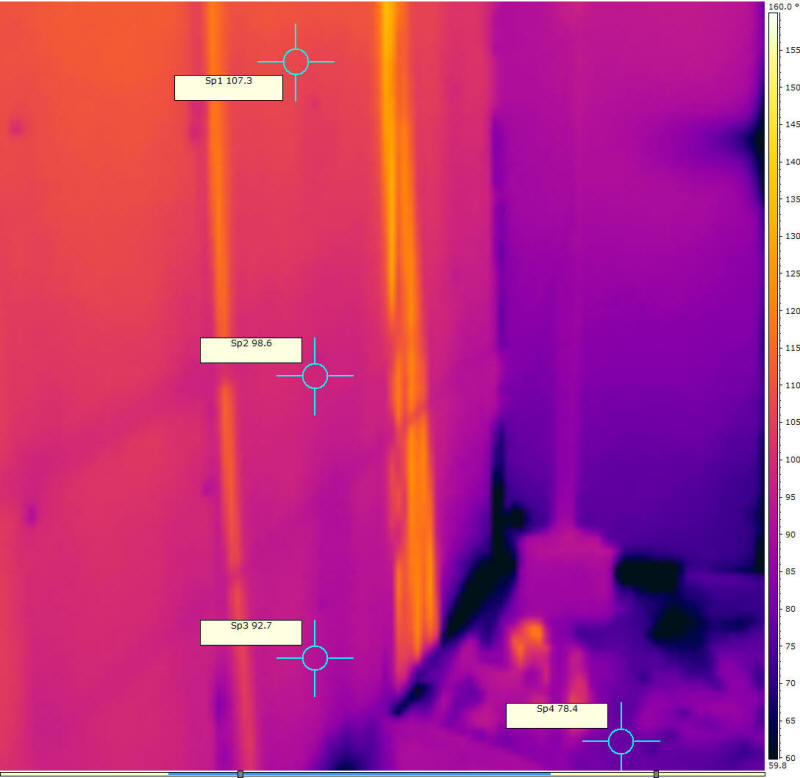
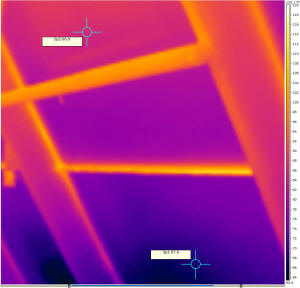
Inside the Sunspace
Back of sunspace (north of the vertical fabric curtain):
You have to click on these pictures to see the temperature labels
North roof behind fabric curtain.
Curtain is visible to right.
East fan is the circular item. |

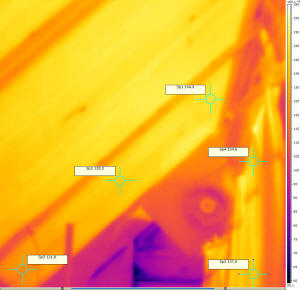
North wall and north ceiling.
Lower part of north ceiling and all
of North wall are shaded by the fabric curtain. |
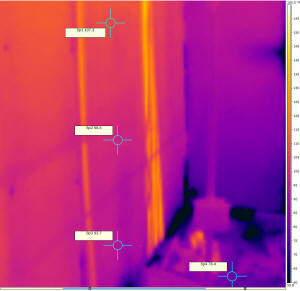
Lower part of North wall.
Fabric curtain out of view to the right. |
All done with temperature range of 60F to 160F and emissivity of 0.95.
Front of sunspace (south of the vertical fabric curtain):