
Search
The Renewable Energy site for Do-It-Yourselfers
Our PV System Two
Year Update
|
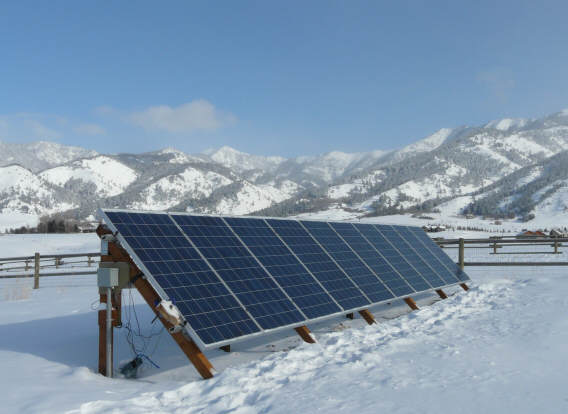
Our DIY PV system has been up and running for
two full years, so I thought I would give an update on how things are
going.
|
|
Maintenance
The system has been completely
trouble free.
The only maintenance has been:
- Mowing the grass around array
once in a while.
- Cleaning off the PV panels once
in a while (garden hose).
- Clearing snow off the panels
after snow storms (this is a quick job with a broom, and is not really
critical as the snow usually melts off fairly quickly)
- Checking all the PV panel hold
down bolts -- did not find any loose ones, and probably won't need to do
this again. Also looked the whole thing over for any anomalies -- none
found.
- Applied some more preservative
to the treated wood posts near the ground and at the joints and any other
place it looked like it could use some. Half an hour total. This
is probably an every couple of years job.
The Enphase internet monitoring of
the system provides regular reports on the health of the system. The only
reports from the Enphase server was for a couple of hours when it said the
utility frequency was not in range and the inverters were shutting down until
the utility frequency got back in range. I think the total down time was
an hour or two. This happened one time only, and I don't really know the
cause -- perhaps the utility frequency did get out of range for a bit.
Performance
Before building the system, I used
PVWatts to estimate what the performance would be. The results are pasted
in below.
I used Billings, MT as Bozeman was
not available, and I adjusted the derate factor from 0.77 up to 0.82 as
recommended by Enphase.
The PVWatts predicted output was 3073
KWH for the year.
The lifetime output for the system is
now reported as:
First Year: Nov 10, 2000 through Nov 9, 2010 was 3291 KWH
(Enphase report in Excel for 2009-2010)...
2nd Year: Nov 10, 2010 through Nov 9, 2011 was 3051
KWH (Enphase report in Excel for 2010-2011)...
The system actually started operation
on Nov 6, 2009, but the first few days the system was off and on operation, so
I've dropped those days.
My own records showed 3320 KWH for
the first year, so there is a little disagreement with the 3291 for the Enphase
report. I've decided to go with the Enphase numbers. The only
reason I was initially keeping my own records was that our internet connection
was not able to support the Enphase reporting system.
So, the 2nd year is down about 7%
from the first year. I believe that this is mainly due to the near
record setting cloudy weather we have been experiencing. The same La Nina
weather pattern that brings the news reports of near record setting droughts to
the SW pushes the jet stream further north, and gives us much more cloudy
weather and more precipitation. The production of our solar thermal
system was also less than typical last year. There is also normally a
small degradation each year as the PV panels age, but, I think the weather is
most of the 7%.
There is a day by day plot for the
whole year at the bottom of this page...
The weather man is saying that the
same La Nina weather pattern is setting up for this winter, so we may have
another lower sun winter -- bummer.
I would say that the first years
production is probably the more typical, or even on the low side as it was also
a more cloudy than average winter.
This is the PVWatts output for our PV
array just for reference:
 |
* * * |
AC Energy
&
Cost Savings |
|
 |
| Station
Identification |
| City: |
Billings |
| State: |
Montana |
| Latitude: |
45.80° N |
| Longitude: |
108.53° W |
| Elevation: |
1088 m |
| PV System Specifications |
| DC Rating: |
2.2 kW |
| DC to AC Derate Factor: |
0.820 |
| AC Rating: |
1.8 kW |
| Array Type: |
Fixed Tilt |
| Array Tilt: |
45.0° |
| Array Azimuth: |
180.0° |
| Energy Specifications |
| Cost of Electricity: |
7.9 ¢/kWh |
|
|
|
Results |
Month |
Solar Radiation
(kWh/m2/day) |
AC Energy
(kWh) |
Energy Value
($) |
| 1 |
3.23 |
187 |
14.77 |
| 2 |
4.16 |
213 |
16.83 |
| 3 |
5.21 |
287 |
22.67 |
| 4 |
5.29 |
269 |
21.25 |
| 5 |
5.79 |
297 |
23.46 |
| 6 |
6.02 |
286 |
22.59 |
| 7 |
6.60 |
318 |
25.12 |
| 8 |
6.33 |
308 |
24.33 |
| 9 |
5.88 |
285 |
22.52 |
| 10 |
4.77 |
253 |
19.99 |
| 11 |
3.61 |
197 |
15.56 |
| 12 |
3.02 |
174 |
13.75 |
| Year |
5.00 |
3073 |
242.77 |
|
Our Electricity Consumption
For our first year on the system, our
utility bills averaged around 200 KWH per month (this is with the PV system in
operation).
For the 2nd year, our utility bills
have been more erratic and higher -- averaging about 330 KWH per month.
It was my goal after the first year
to drop our consumption down some from the 200 KWH per month, and obviously we
failed there, since the average bill went up. I can blame about 20 KWH
per month on the lower PV production, but clearly most of the increase is our
fault.
I still have it on the list of things
to do a bottoms up analysis of where the electricity goes and see if some
improvements can be made.
We started at about 1000 KWH per
month and got this down to right around
500 KWH per month through
conservation measures -- we spent about $1,200 implementing the various
conservation projects.
The PV system reduced our net
consumption by about another 275 KWH per month down to around 200 KWH per month.
The PV system cost about $10,000 before rebates and
about $6,500 after rebates.
So, one clear message here is that
even though PV systems have come down in price, doing conservation and
efficiency changes is FAR more cost effective than PV -- at least in our case.
I'd say do the conservation measures first, and then think about doing a PV
array.
Impressions
I've built several solar thermal
(heating) systems, but this is the first solar electric system I've built --
these are some impressions on how the two types of systems compare:
-
The high reliability and low
maintenance of the PV system is impressive. The solar PV equipment
appears to have gotten to the point where you can just about forget it.
Solar thermal systems seem to require a bit more attention -- its not they
they are high maintenance, but there are a few things you need to check once
in a while.
-
While the solar electric systems
are not nearly as efficient under sunny conditions as solar thermal system
(it takes 3 or 4 times the collector area of PV collectors compared to solar
thermal collectors to make the same amount of energy), it is impressive how
PV panels continue to generate some power (albeit not much) even under
difficult conditions. Long after the solar thermal panels have stopped
producing any energy the solar electric panels are still trickling out some
power.
-
In spite of the fact that
PV has come down in price, the price per KWH of energy produced for DIY PV
systems is much greater than the cost per KWH of energy for DIY solar
thermal systems.
When you compare the PV to the
$1000 Solar Water
Heating system, the comparison is very lopsided -- the two systems
produce about the same amount of energy, but the $1K Solar Water Heating
System only costs about $1,000 BEFORE rebates, compared to $10,000 for the
PV system.
Both kinds of systems (thermal and
PV) are a lot of
fun to build and own!
DIY Install Savings Update
I've done an update on what the
typical saving for a DIY installation of a PV system might be based on prices
published in Solar Today magazine for typical installed PV prices across the
country in September 2011...
In a nutshell, our DIY system cost
52% less than the average US PV installation of the same size -- as saving of
about $8000.
Reports
Enphase provides a variety of nice
reports.
Here is one example that I like.
It shows the lifetime power production for each of the 10 PV modules of the
system.
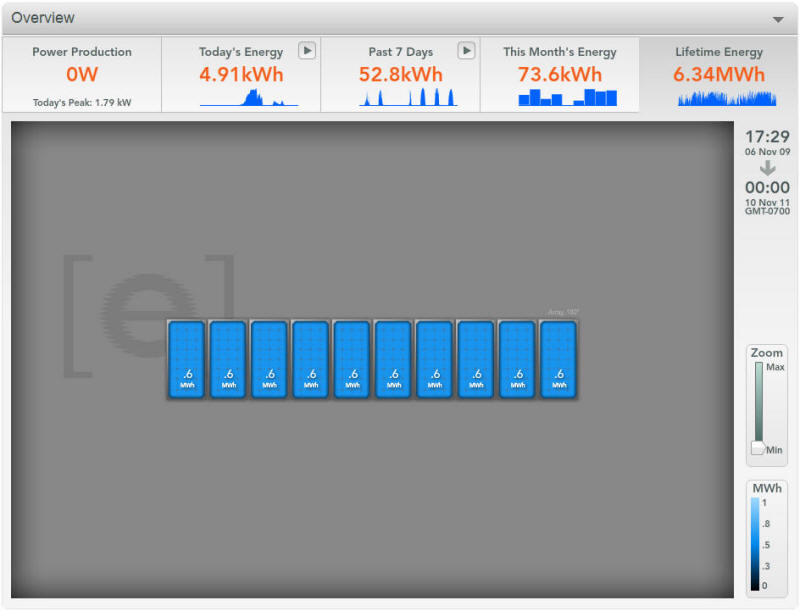
The nice thing about this is that you
can tell at a glance that each of the modules has had the same total production,
so they are all working OK.
On non micro-inverter systems, it can
be difficult to tell if one module has a problem of some sort and is not
producing up to the level of the others. Some of these problems go
undetected for years.
Plot of Daily
Output for 2 Years
This shows the day by day output for
the first two years. The blue bars are the first year, and red the 2nd
year. This is one of the regular downloadable Enphase reports.
Gary
November 10, 2011